云原生监控系统 Prometheus大总结 20250909
本章内容如下:
一、核心定位
Prometheus 以 “采集并存储时间序列数据,通过规则引擎分析数据并触发告警” 为核心目标,专注于解决分布式系统下的 “可观测性” 问题 —— 即帮助运维 / 研发团队实时掌握系统的运行状态(如服务器资源、服务性能、业务指标等),快速定位故障根源。
二、核心组件及架构
Prometheus 采用模块化架构,核心组件可按需组合,典型架构如下:
| 组件名称 | 核心功能 |
|---|---|
| Prometheus Server | 核心组件,负责从目标(Targets)采集指标、存储时间序列数据、执行查询和告警规则。 |
| Exporters | 指标采集器,将非 Prometheus 格式的指标(如服务器 CPU、MySQL 性能、Nginx 连接数)转换为标准格式并暴露给 Server。常见 Exporters: - node_exporter:采集服务器硬件 / 系统指标(CPU、内存、磁盘等)- mysql_exporter:采集 MySQL 数据库指标(连接数、慢查询、主从同步状态等)- nginx_exporter:采集 Nginx 性能指标(请求量、响应时间、错误率等) |
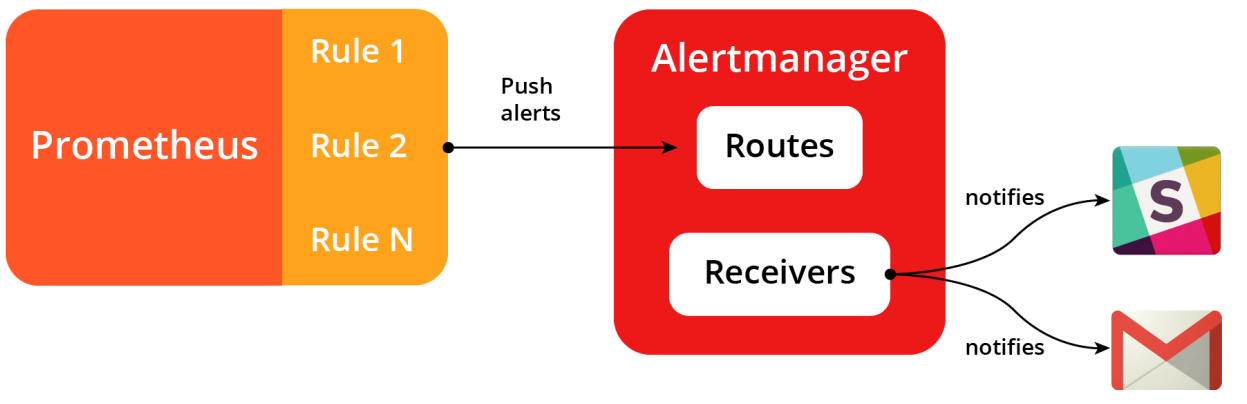
| Alertmanager | 告警管理组件,接收 Server 触发的告警,负责去重、分组、路由(如推送到钉钉、邮件、Slack)及告警升级。 |
| Grafana | 可视化组件(非 Prometheus 官方核心组件,但必配),通过连接 Prometheus 数据源,生成仪表盘(Dashboard),支持折线图、柱状图等多种可视化形式,直观展示指标趋势。 |
| Pushgateway | 指标推送网关,用于采集 “短生命周期任务”(如临时脚本、批处理任务)的指标 —— 这类任务存在时间短,Server 来不及主动采集,可先推送到 Pushgateway,再由 Server 定期拉取。 |
| Service Discovery | 服务发现组件,自动发现待监控的目标(如 K8s 集群中的 Pod、服务),无需手动配置 Targets,适配动态变化的云原生环境。 |
三、核心工作原理(“拉取式” 监控流程)
Prometheus 采用 **“主动拉取(Pull)”** 为核心的监控模式,流程可分为 4 步:
- 指标暴露:Exporters 部署在目标机器 / 服务上,通过 HTTP 接口(默认
/metrics)暴露标准化指标(如node_cpu_seconds_total{cpu="0",mode="idle"} 12345)。 - 指标采集:Prometheus Server 按配置的 “采集间隔”(如 15 秒),主动向 Exporters/Pushgateway 的
/metrics接口发起 HTTP 请求,拉取指标数据。 - 数据存储:拉取的指标以 “时间序列数据(Time Series)” 格式存储在本地 TSDB(时序数据库)中,每条时间序列由 “指标名 + 标签(Labels)” 唯一标识(如
http_requests_total{method="GET",path="/login"}),同时关联时间戳和指标值。 - 分析与告警:
- 查询分析:通过 PromQL(Prometheus Query Language,专用查询语言)对 TSDB 中的数据进行实时查询(如计算 “5 分钟内的平均请求响应时间”),并在 Grafana 中展示。
- 告警触发:Server 定期执行 “告警规则”(如 “CPU 使用率连续 5 分钟超过 80%”),当指标满足规则条件时,生成告警并发送给 Alertmanager,由其完成告警分发。
四、核心特性
- 强大的时间序列数据模型:基于 “指标名 + 标签” 的二维模型,支持多维度筛选(如按 “服务名”“环境”“节点” 过滤指标),灵活适配复杂业务场景。
- 灵活的查询语言 PromQL:支持聚合(
sum/avg)、过滤(==/!=)、时间范围([5m])等操作,可快速计算衍生指标(如rate(http_requests_total[5m])计算 5 分钟内的请求速率)。 - 高效的本地存储:内置 TSDB 针对时序数据优化,支持数据压缩(压缩率可达 10:1),单节点可存储数月数据,同时支持对接远程存储(如 Thanos、Cortex)实现海量数据持久化。
- 原生支持服务发现:适配 K8s、Consul、etcd 等主流服务发现机制,自动适配动态扩缩容的云原生环境,无需手动维护监控目标列表。
- 轻量且易部署:所有组件均为独立二进制文件,无复杂依赖,支持容器化部署(Docker/K8s),单节点即可快速搭建基础监控体系。
- 开放性生态:支持数百种 Exporters(覆盖数据库、中间件、云服务等),且可自定义 Exporter(如用 Python/Go 开发业务指标采集器),与 Grafana、Alertmanager 等工具无缝集成。
五、典型应用场景
- 云原生 / 容器监控:监控 K8s 集群的 Pod、Node、Service 状态(如 Pod 重启次数、Node 资源使用率),以及容器内服务的性能指标(如容器 CPU / 内存占用、应用响应时间)。
- 传统 IT 基础设施监控:通过
node_exporter监控物理机 / 虚拟机的硬件资源(CPU、内存、磁盘 IO、网络带宽),通过mysql_exporter/redis_exporter监控数据库、缓存等中间件。 - 业务指标监控:自定义 Exporter 采集业务指标(如订单量、支付成功率、用户在线数),结合系统指标实现 “业务 - 系统” 全链路监控。
- 告警与故障排查:通过定制化告警规则(如 “支付接口错误率> 1% 触发 P1 告警”),结合 PromQL 查询和 Grafana 可视化,快速定位故障(如 “某节点磁盘满导致服务响应延迟”)。
六、与传统监控工具(如 Zabbix)的核心区别
Prometheus 与传统监控工具的差异主要源于 “云原生时代的需求适配”,具体对比如下:
| 维度 | Prometheus | Zabbix(传统监控) |
|---|---|---|
| 监控模式 | 主动拉取(Pull)为主,支持推送(Pushgateway) | 被动监听(Agent 推送)为主 |
| 数据模型 | 时间序列 + 标签(多维度) | 键值对(单维度) |
| 动态适配性 | 原生支持服务发现,适配 K8s 动态扩缩容 | 需手动配置监控目标,动态场景适配成本高 |
| 部署复杂度 | 轻量,单节点可部署,容器化友好 | 架构复杂(Server/Agent/DB 分离),部署成本高 |
| 查询能力 | PromQL 灵活强大,支持复杂聚合与多维度分析 | 自定义查询能力弱,依赖预设模板 |
| 生态适配 | 深度集成云原生生态(K8s/Docker) | 更适配传统物理机 / 虚拟机环境 |
正片开始
1.Prometheus 介绍
官方文档:
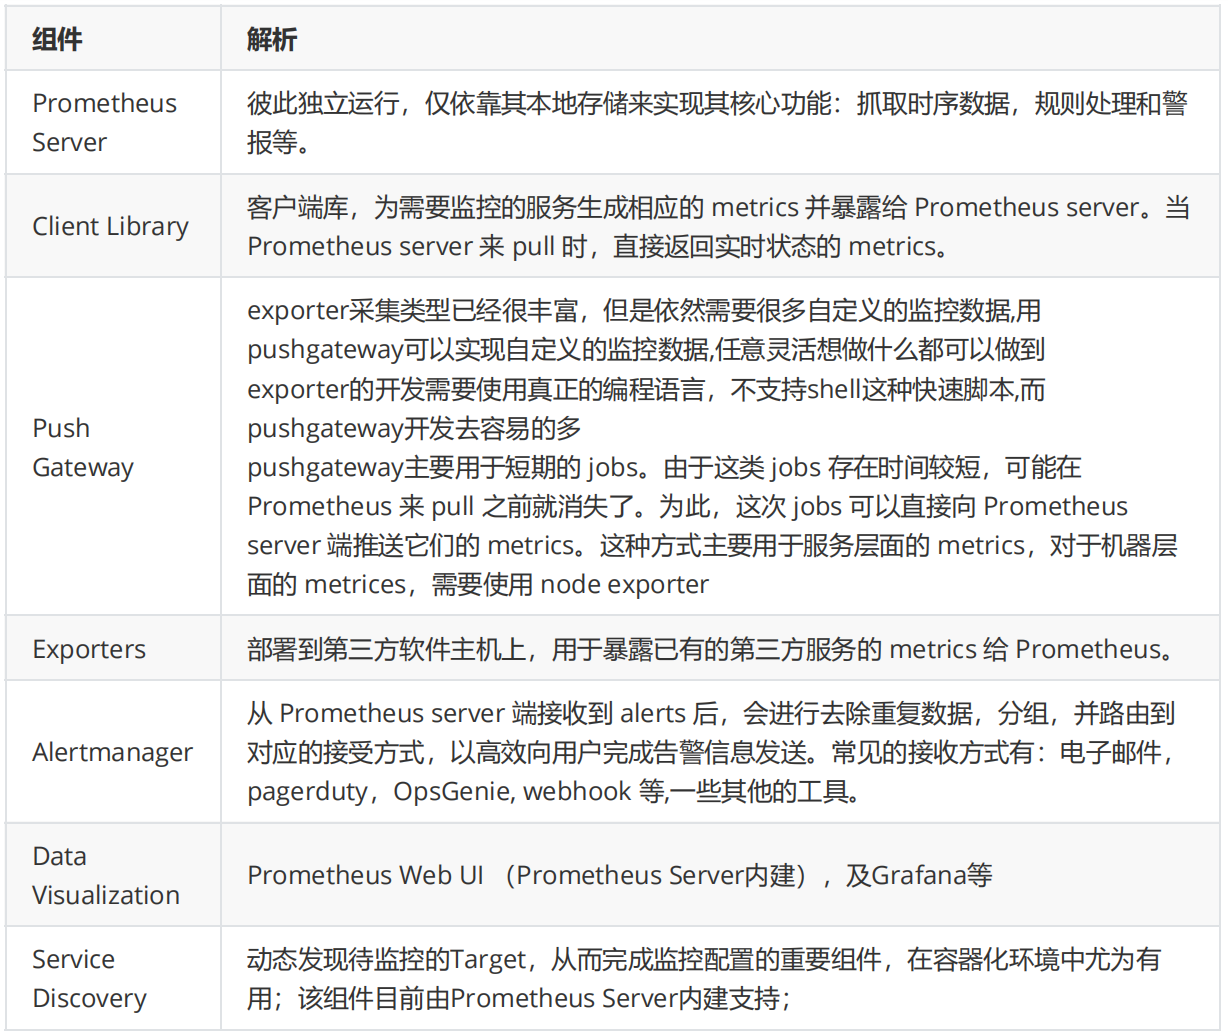
工作流程
Prometheus 只负责时序型指标数据的采集及存储
2.Prometheus 部署和配置
①ubuntu包安装
apt install prometheus 其他安装略
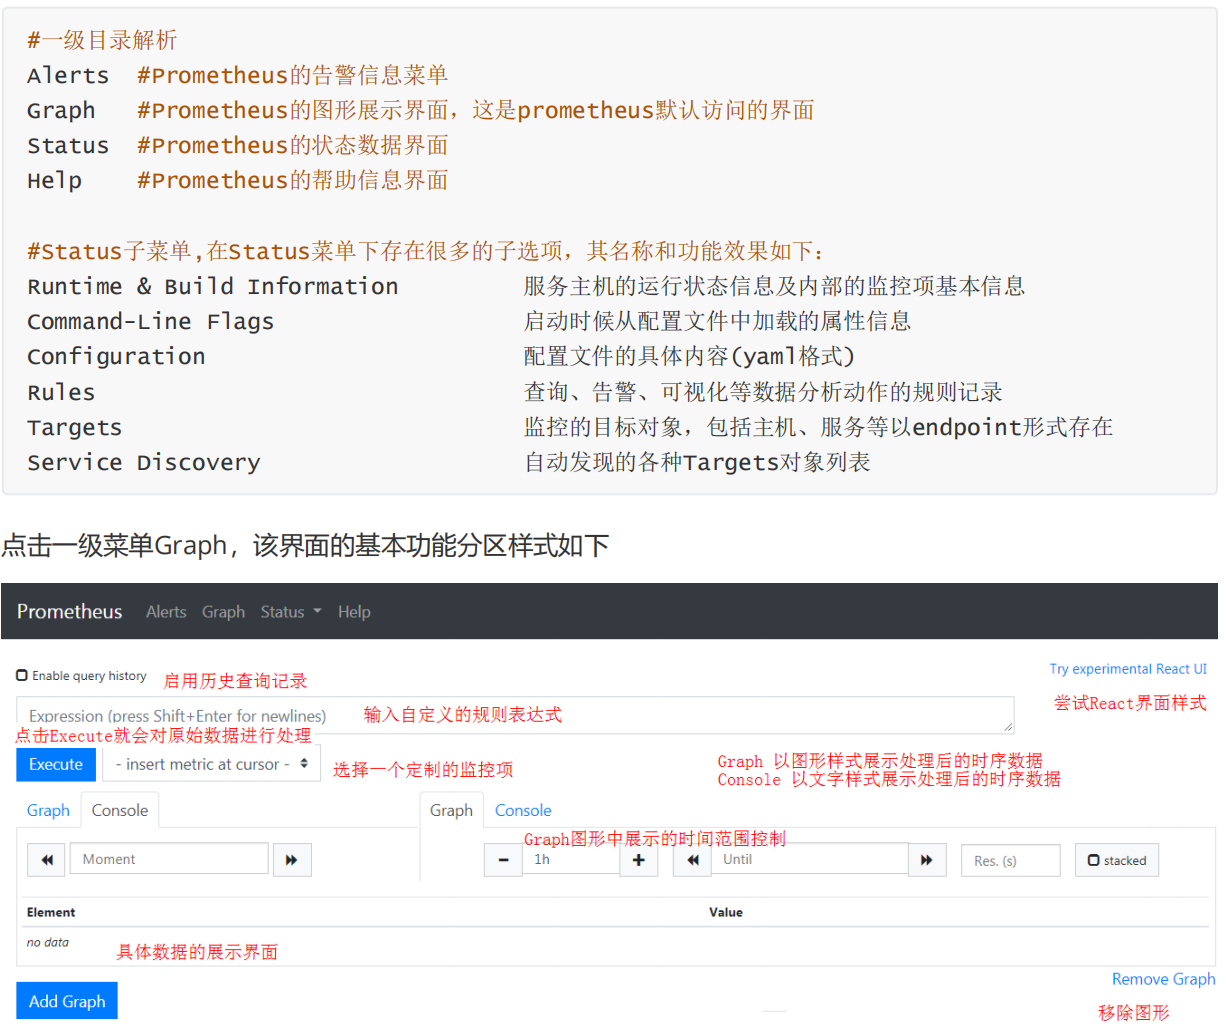
Dashboard 菜单说明
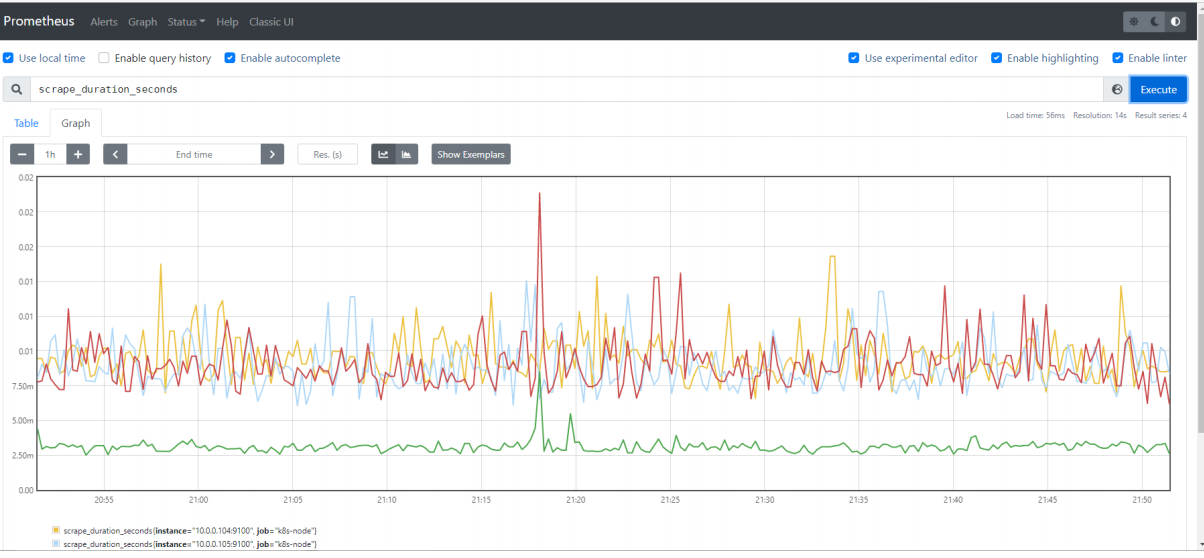
我们选择一个监控项"scrape_duration_seconds",然后点击"Execute",查看效果
查看所有的监控项: 10.0.0.203:9090/api/v1/label/__name__/values
API访问
......
[root@ubuntu2204 ~] #curl http://prometheus.wang.org:9090/-/healthy
[root@ubuntu2204 ~] #curl http://prometheus.wang.org:9090/-/ready
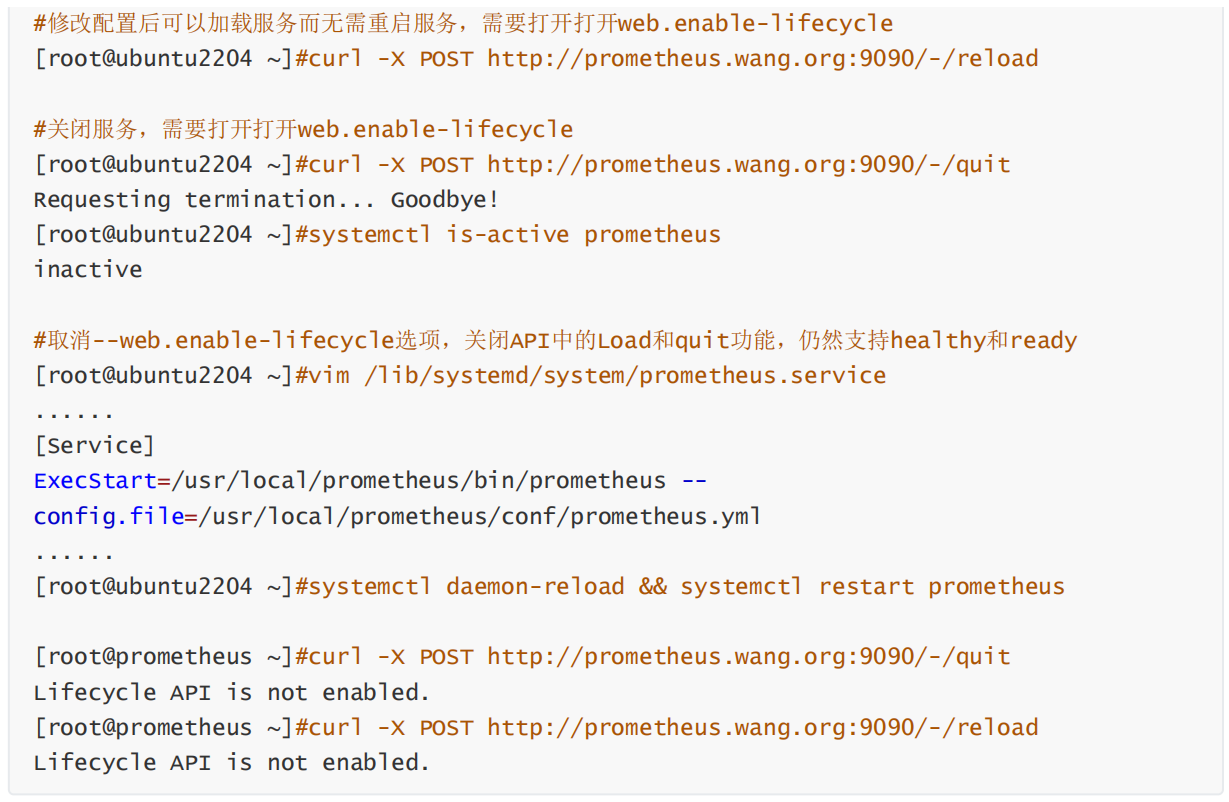
优化配置
②Node Exporter 安装
其他安装方式略
[root@node1 ~]#wget -P /usr/local/
https://github.com/prometheus/node_exporter/releases/download/v1.2.2/node_exporter-
1.2.2.linux-amd64.tar.gz
[root@node1 ~]#cd /usr/local
[root@node1 local]#tar xvf node_exporter-1.2.2.linux-amd64.tar.gz
[root@node1 local]#ln -s node_exporter-1.2.2.linux-amd64 node_exporter
[root@node1 local]#cd node_exporter
[root@node1 node_exporter]#mkdir bin
[root@node1 node_exporter]#mv node_exporter bin/
[root@node1 ~]#useradd -r -s /sbin/nologin prometheus
[root@node1 ~]#chown -R prometheus:prometheus /usr/local/node_exporter/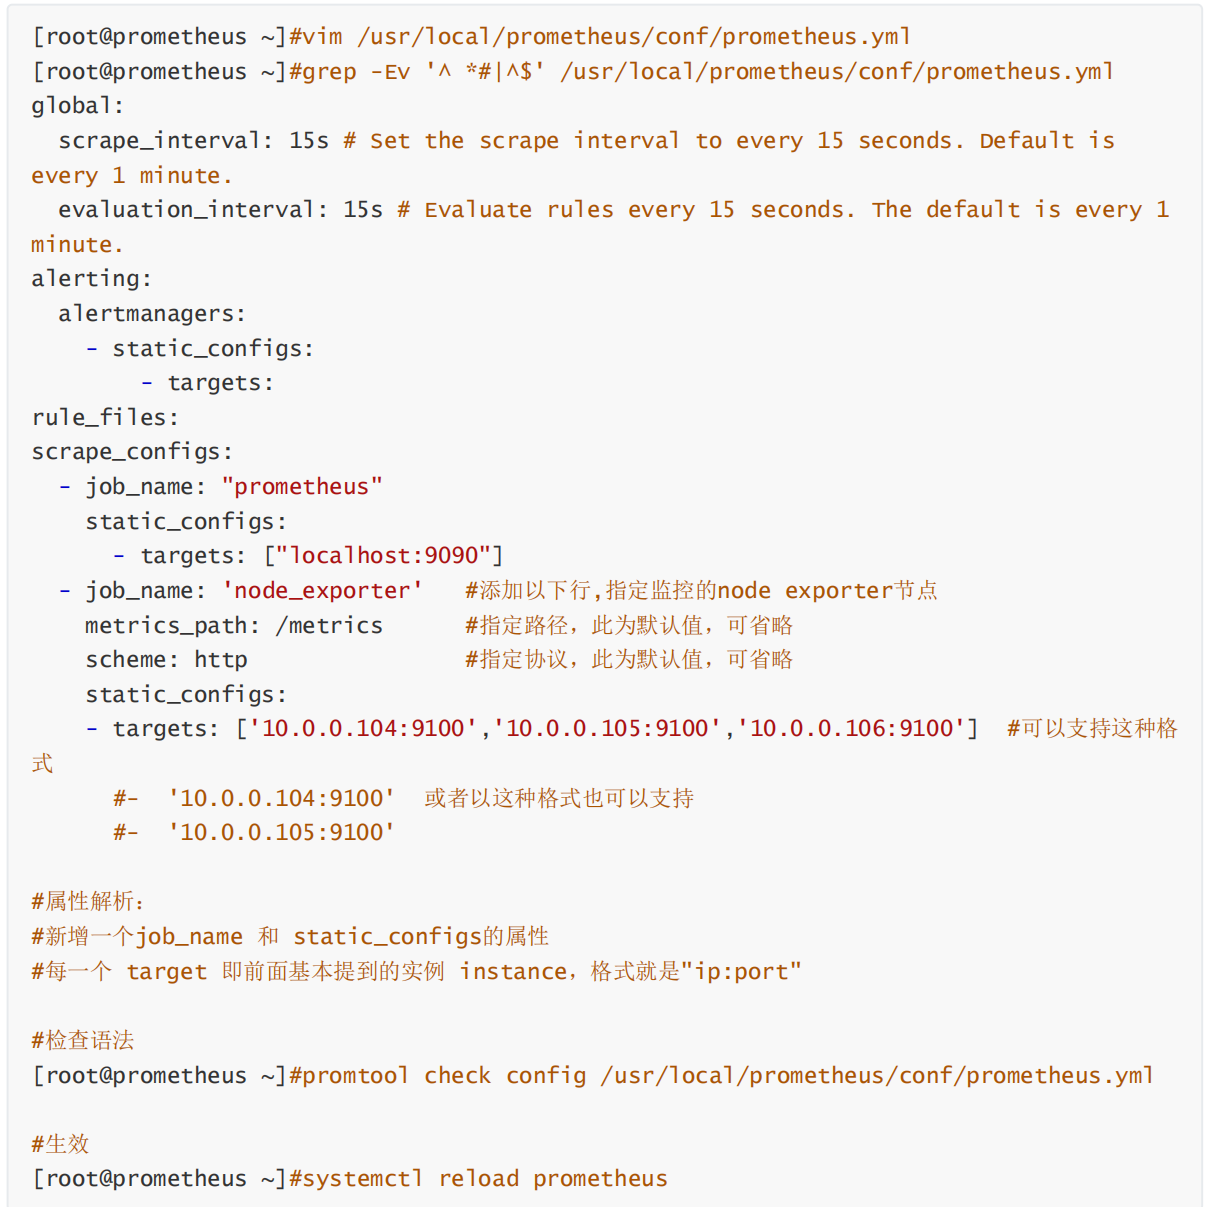
关键点儿提炼:
- job_name: 'node_exporter'   #添加以下行,指定监控的node exporter节点
  metrics_path: /metrics      #指定路径,此为默认值,可省略
  scheme: http                #指定协议,此为默认值,可省略
  static_configs:
- targets: ['10.0.0.104:9100','10.0.0.105:9100','10.0.0.106:9100']
个人实际实践,只需要在原有的node上添加即可
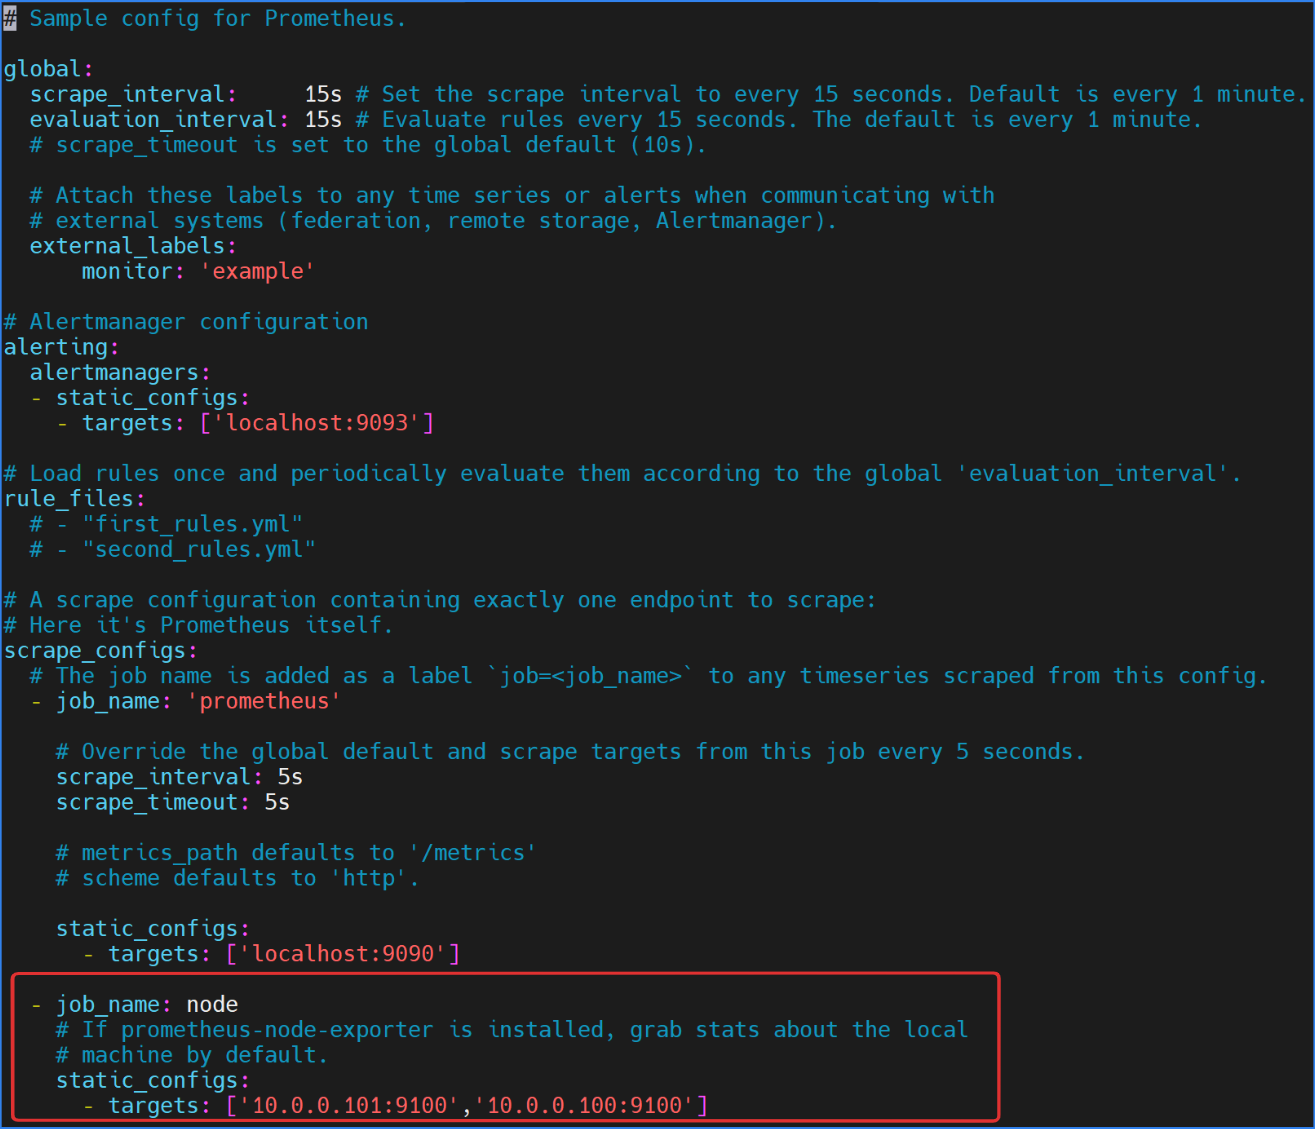
Prometheus 验证 Node 节点状态数据 node_cpu_seconds_total
监控Grafana
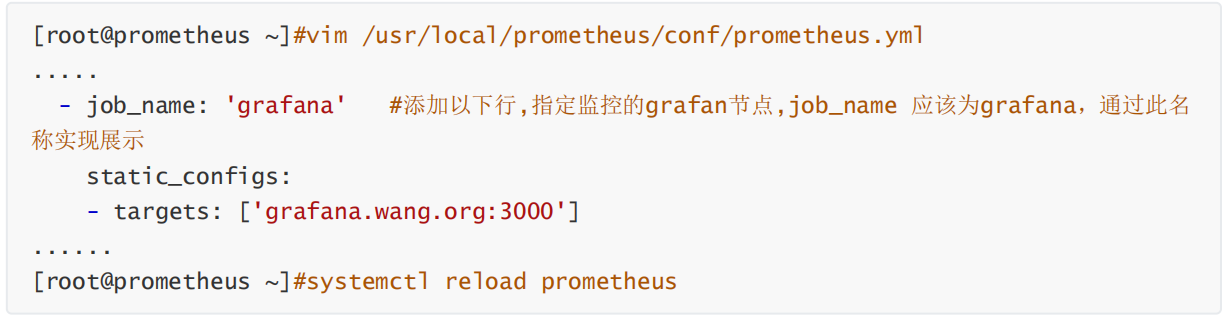
③Pushgateway 采集自定义数据
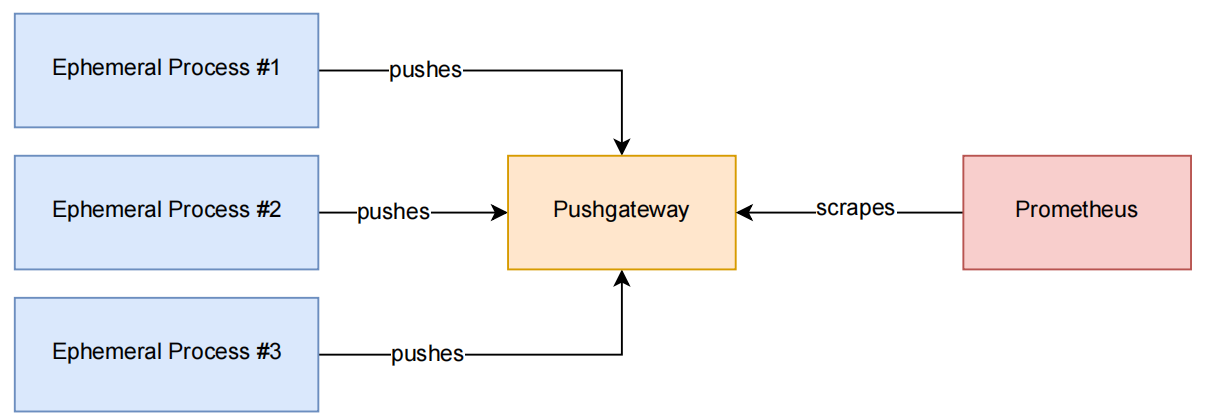
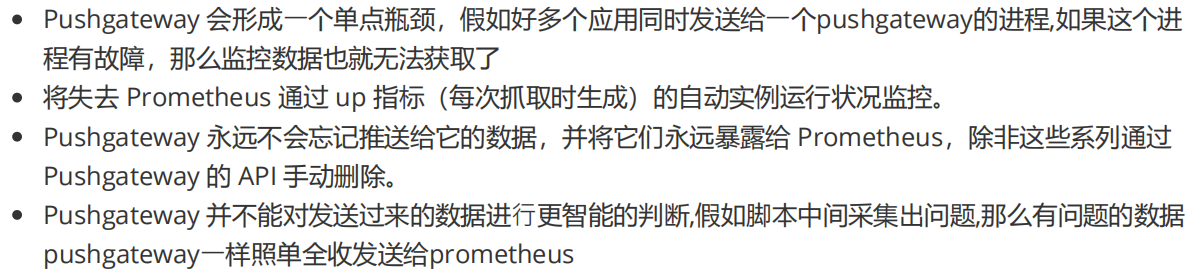
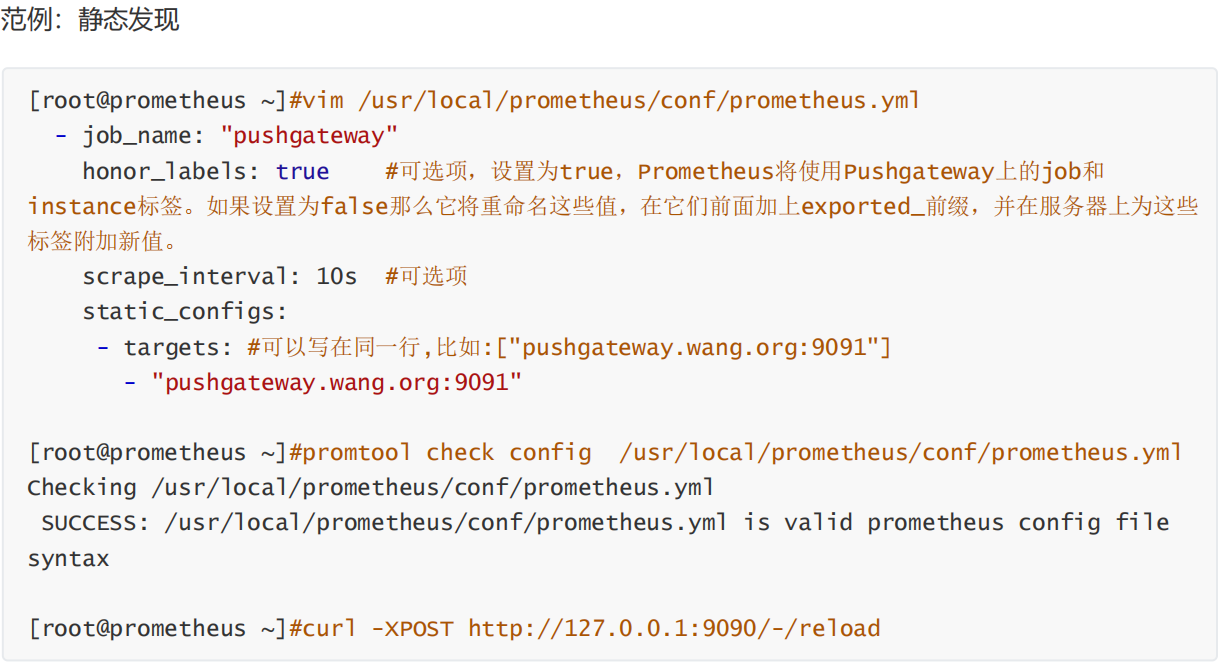
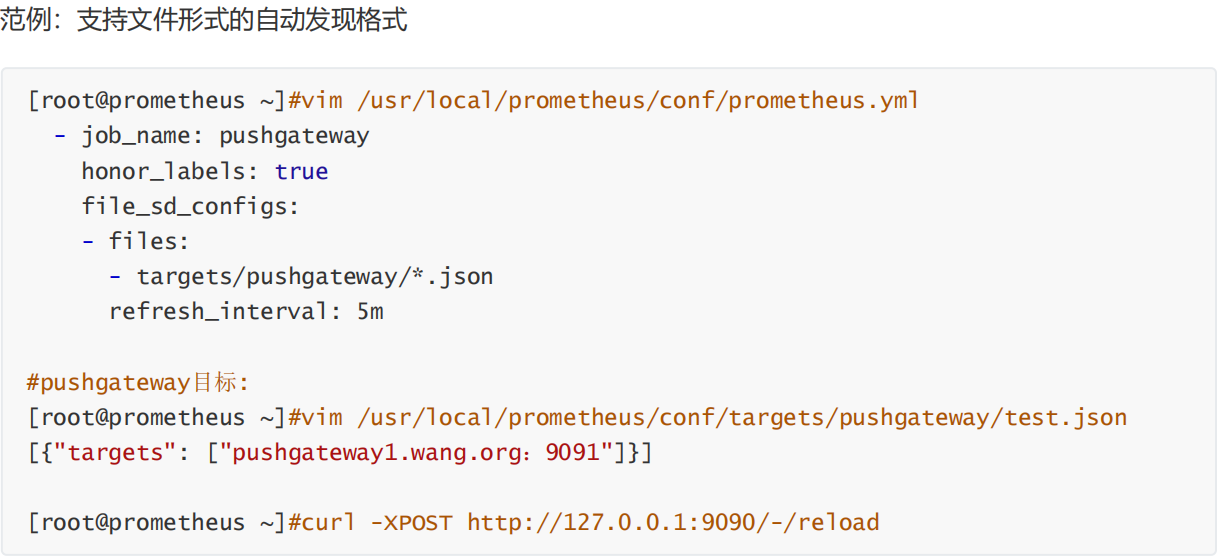
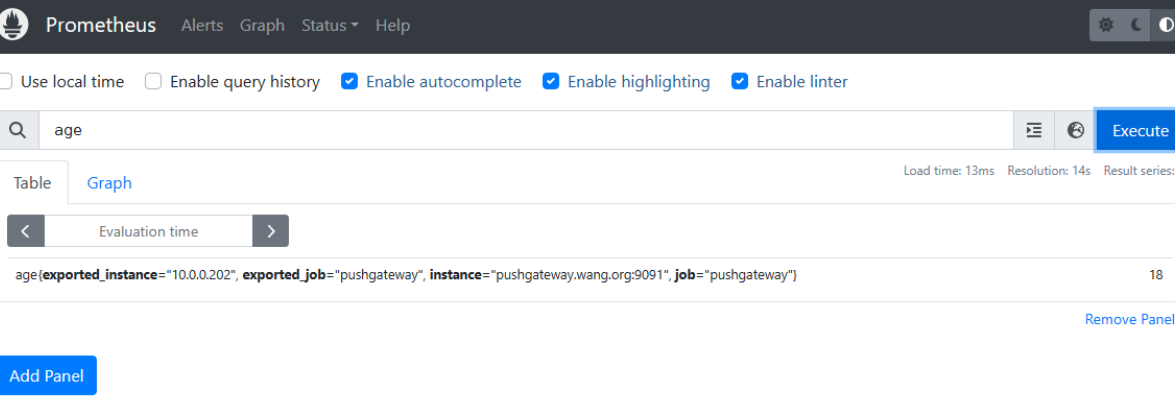
1.配置 Prometheus 收集 Pushgateway 数据
2.配置客户端发送数据给 Pushgateway
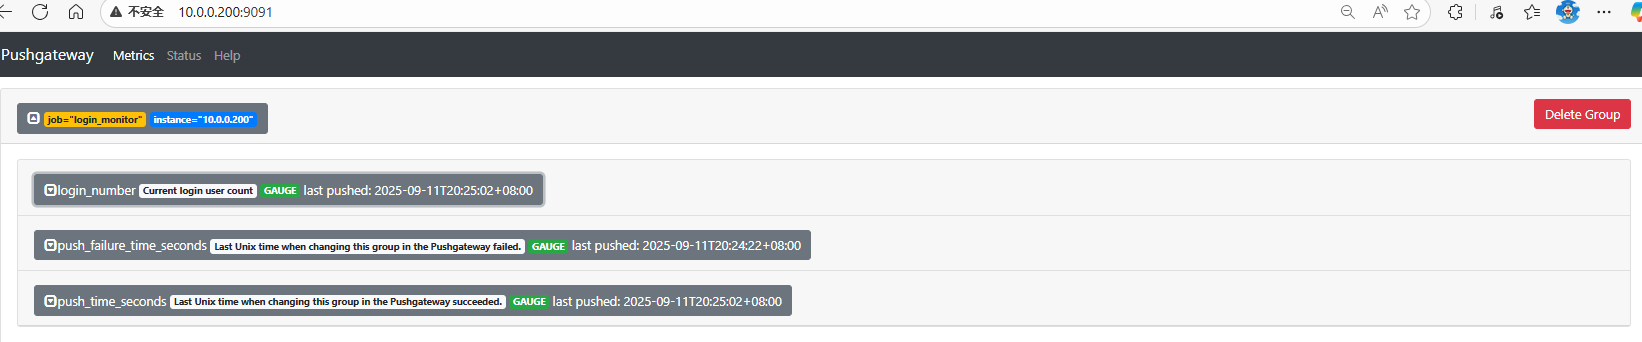

#!/bin/bash

# 监控配置
METRIC_NAME="login_number"
METRIC_VALUE_CMD="who | wc -l"
METRIC_TYPE="gauge"
METRIC_HELP="Current login user count"

# Pushgateway配置
PUSHGATEWAY_HOST="10.0.0.200:9091"  # 修改为您实际的Pushgateway地址
EXPORTED_JOB="login_monitor"
INSTANCE=$(hostname -I | awk '{print $1}')
SLEEP_INTERVAL=5  # 推送间隔(秒)

# 推送函数
push_metric() {
    while true; do
        VALUE=$(eval "$METRIC_VALUE_CMD")

        echo "Pushing metric: ${METRIC_NAME} ${VALUE}"

        cat <<EOF | curl --max-time 5 --data-binary @- \
            "http://${PUSHGATEWAY_HOST}/metrics/job/${EXPORTED_JOB}/instance/${INSTANCE}"
# HELP ${METRIC_NAME} ${METRIC_HELP}
# TYPE ${METRIC_NAME} ${METRIC_TYPE}
${METRIC_NAME} ${VALUE}
EOF

        sleep ${SLEEP_INTERVAL}
    done
}

# 启动推送
push_metric
3.PromQL
Prometheus 提供一个内置的函数式的表达式语言PromQL(Prometheus Query Language),可以帮助用户实现实时地查找和聚合时间序列数据。
#即时数据,指定时间点的数据
[root@ubuntu2204 ~]#date -d @1600000000
2020年 09月 13日 星期日 20:26:40 CST
#查看2020年 09月 13日的数据

[root@prometheus ~]#curl --data 'query=prometheus_http_requests_total' --data
time=1600000000 'http://10.0.0.100:9090/api/v1/query'
#范围数据,指定时间前1分钟的数据

[root@prometheus ~]#curl --data 'query=node_memory_MemFree_bytes{instance=~"10.0.0.
(101|102):9100"}[1m]' --data time=1600000000 'http://10.0.0.100:9090/api/v1/query'
#标量数据,利用scalar()函数将即时数据转换为标量

[root@prometheus ~]#curl --data
'query=scalar(sum(node_memory_MemTotal_bytes{instance=~"10.0.0.(101|102):9100"}))' --
data time=1600000000 'http://10.0.0.100:9090/api/v1/query'rate函数=时间区间前后两个点的差 / 时间范围4.定制开发Exporter
~ # apt update && apt install -y python3-pip # 安装 Python 包管理器,默认没有安装
#安装虚拟环境软件
~# apt install python3-stevedore python3-virtualenvwrapper
#创建用户
~# useradd -m -s /bin/bash python
#准备目录
~# mkdir -p /data/venv
~# chown python.python /data/venv
#修改配置文件(可选)
~# su - python
~# vim .bashrc
force_color_prompt=yes #取消此行注释,清加颜色显示

#配置加速
~# mkdir ~/.pip
~# vim .pip/pip.conf
[global]
index-url = https://pypi.tuna.tsinghua.edu.cn/simple
[install]
trusted-host=pypi.douban.com
#配置虚拟软件
echo 'export WORKON_HOME=/data/venv' >> .bashrc
echo 'export VIRTUALENVWRAPPER_PYTHON=/usr/bin/python3' >> .bashrc
echo 'export VIRTUALENVWRAPPER_VIRTUALENV=/usr/local/bin/virtualenv' >> .bashrc
echo 'source /usr/local/bin/virtualenvwrapper.sh' >> .bashrc
source .bashrc

#注意:virtualenv 和 virtualenvwrapper.sh 的路径位置
#创建新的虚拟环境并自动进入
~# mkvirtualenv -p python3 flask_env
#进入已创建的虚拟环境
~# su - python
~# workon flask_env
#虚拟环境中安装相关模块库
~# pip install flask prometheus_client
~# pip list#!/usr/bin/python3
"""
Flask应用监控指标脚本
功能:提供两个HTTP服务端口
- 8000端口:供Prometheus采集监控指标
- 8001端口:接收访问请求,每访问一次/metrics端点会使计数器加1
"""
# 导入所需模块
from prometheus_client import start_http_server, Counter, Summary
from flask import Flask, jsonify
from wsgiref.simple_server import make_server
import time
# 初始化Flask应用
app = Flask(__name__)
# 定义监控指标
# 1. 用于跟踪请求处理时间的摘要指标
REQUEST_TIME = Summary(
'request_processing_seconds',
'Time spent processing request'
)
# 2. 用于计数总请求量的计数器指标
REQUEST_COUNTER = Counter(
"request_count_total",
"Total request count of the host"
)
@app.route("/metrics")
@REQUEST_TIME.time() # 记录该接口的处理时间
def metrics_endpoint():
"""
处理8001端口的/metrics请求
每次访问会使请求计数器加1,并返回成功响应
"""
REQUEST_COUNTER.inc() # 计数器递增1
return jsonify({"return": "success OK!"})
if __name__ == "__main__":
# 启动Prometheus指标暴露服务(8000端口)
start_http_server(8000)
print("Prometheus metrics server started on port 8000")
# 启动Flask应用服务(8001端口,监听所有网络接口)
httpd = make_server('0.0.0.0', 8001, app)
print("Flask application started on port 8001")
# 持续运行服务
httpd.serve_forever()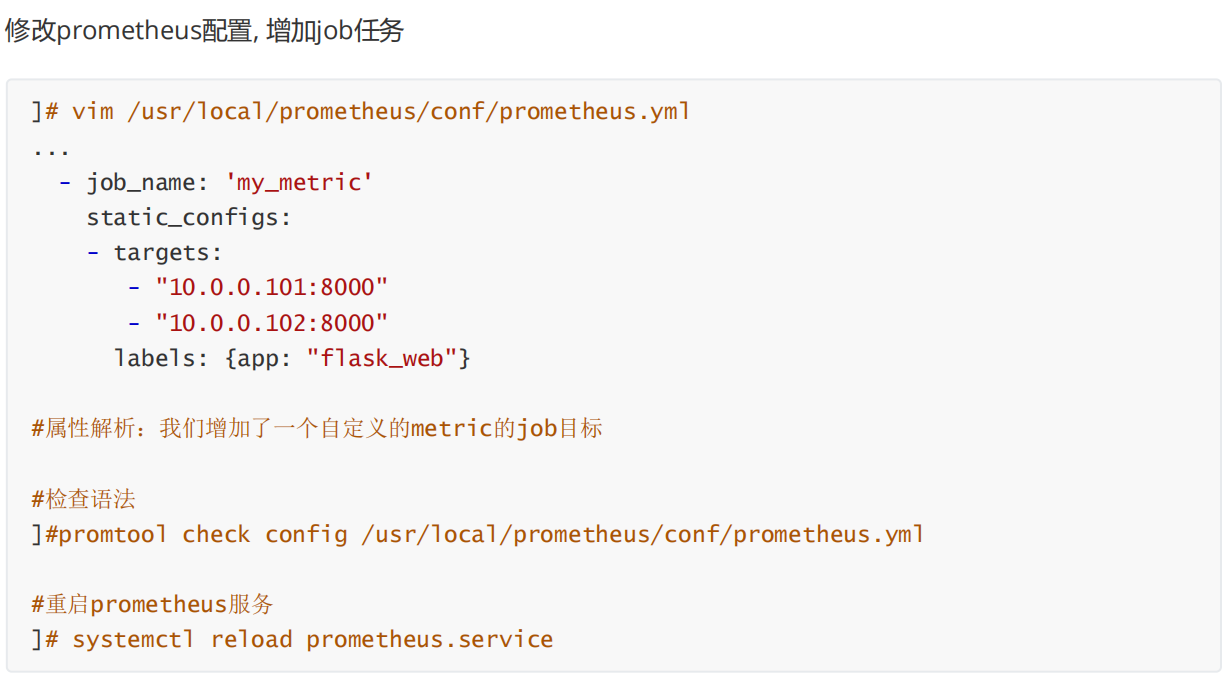
5 Prometheus 标签管理
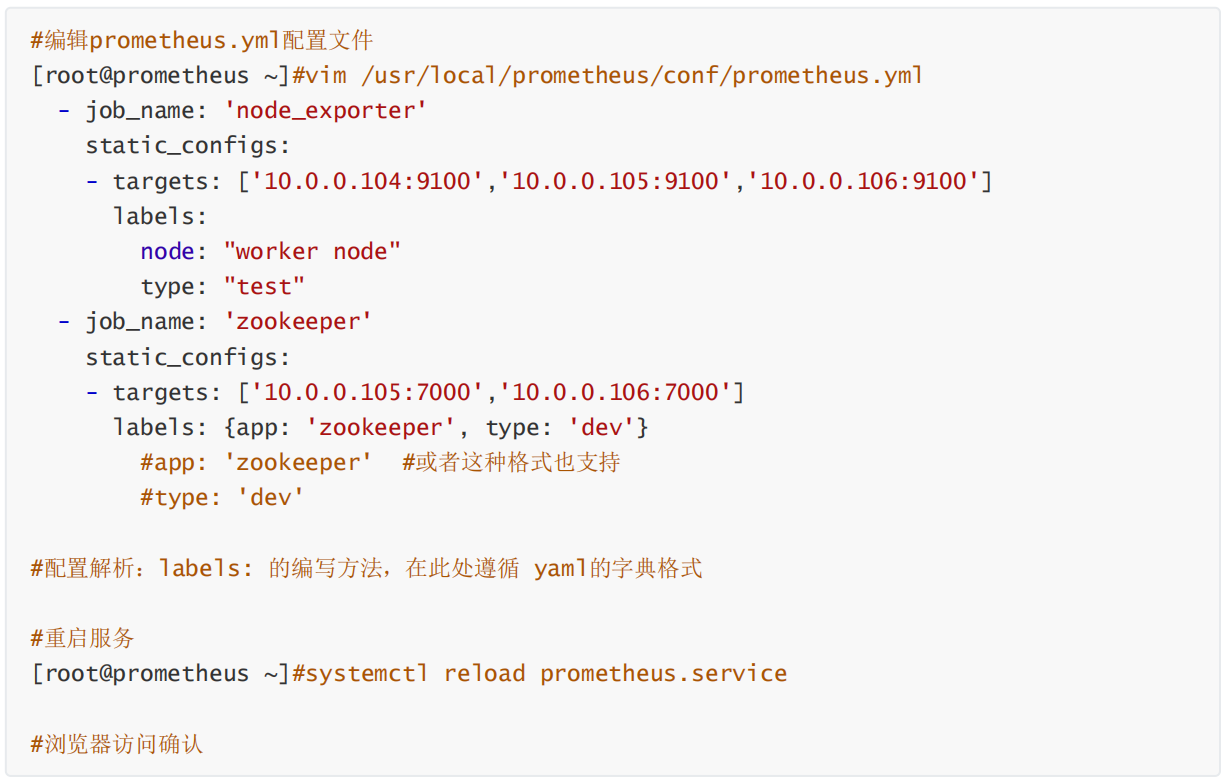
范例:添加主机标签


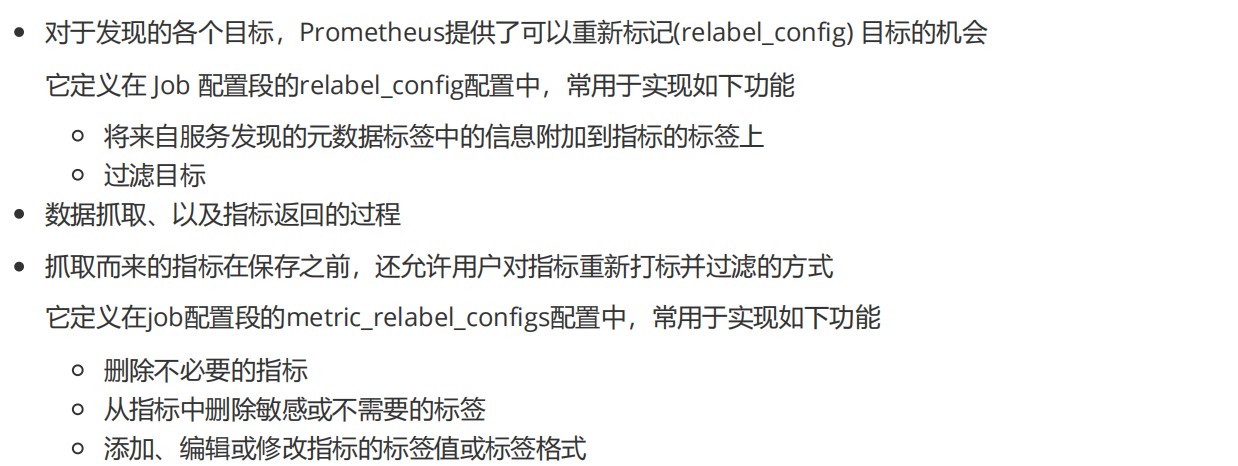
①指标的生命周期
标签的两种形式:
私有标签:以"__*"样式存在,用于获取监控目标的默认元数据属性,比如__address__用于获取目标的地址, __scheme__用户获取目标的请求协议方法,__metrics_path__获取请求的url地址等。
普通标签:对个监控主机节点上的监控指标进行各种灵活的管理操作,常见的操作有,删除不必要|敏感指标,添加、编辑或者修改指标的标签值或者标签格式。
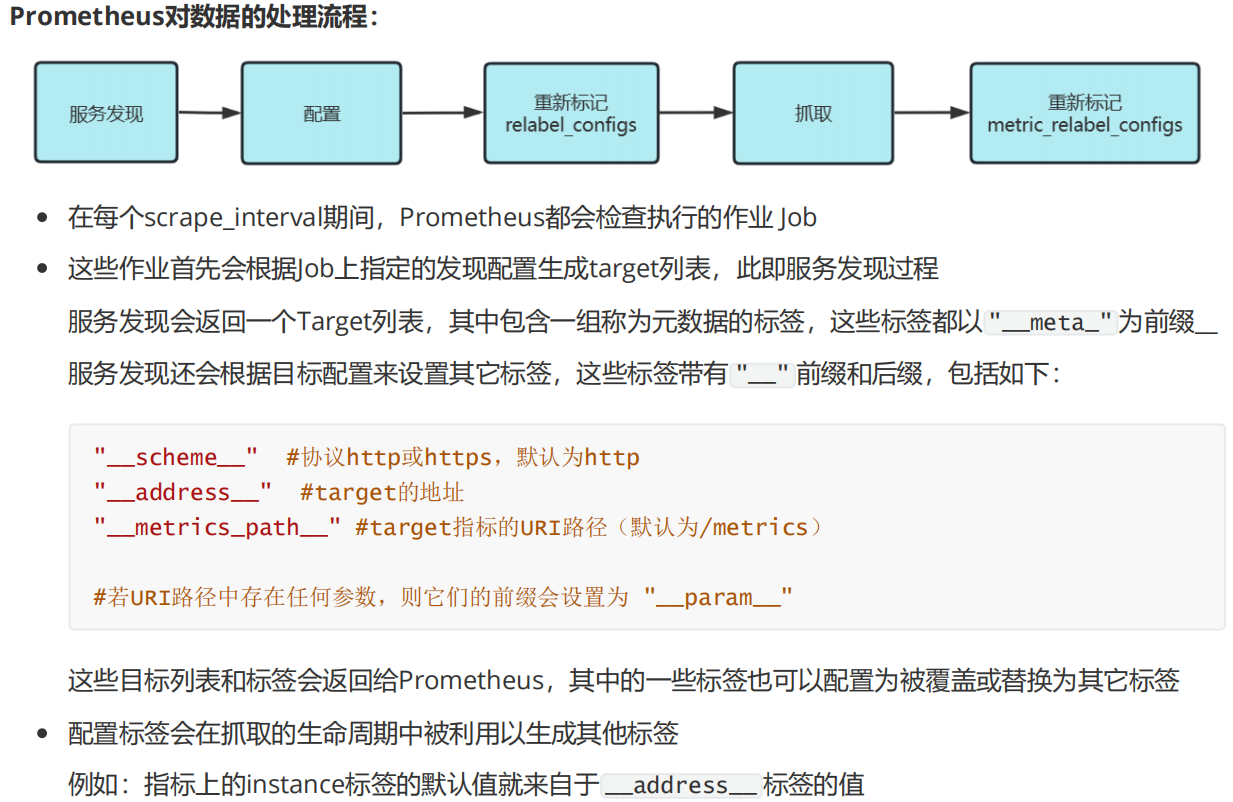
②relabel_configs 和 metric_relabel_configs
| 对比维度 | relabel_configs | metric_relabel_configs |
|---|---|---|
| 执行顺序 | 在 scrape_configs 生效前执行 | 在 scrape_configs 生效后执行 |
| 作用对象 | 针对 target(采集目标)本身 | 针对 metric(监控指标数据) |
| 数据处理 | 对采集目标的标签进行预处理(如过滤目标、修改目标标签等) | 在 Prometheus 保存数据前对指标标签进行最终编辑,可过滤不需要的指标数据(直接丢弃不保存) |
| 核心用途 | 调整采集目标的标签属性,决定哪些目标被采集 | 调整指标的标签属性,决定哪些指标被保存 |
③标签管理
global:
 ...
  # 与外部系统通信时添加到任何时间序列或警报的标签
 external_labels:
   [ <labelname>: <labelvalue> ... ]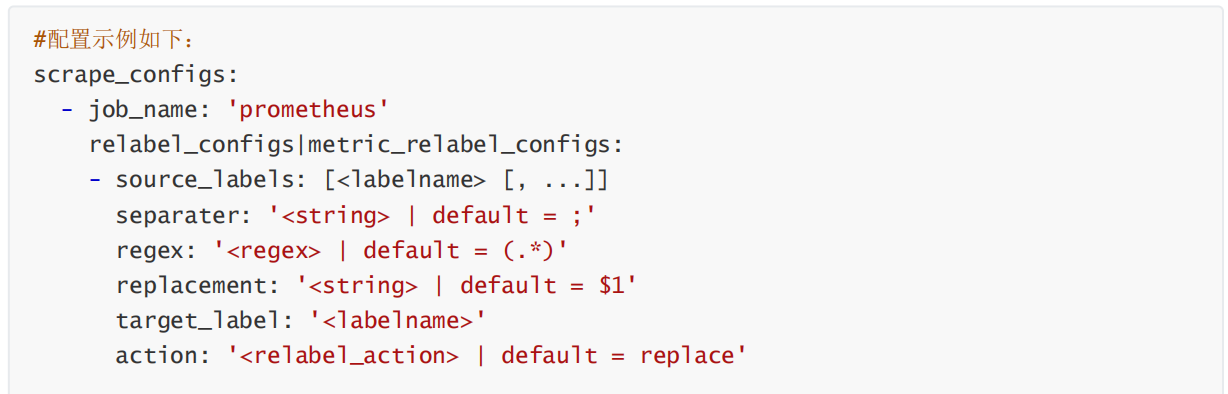
#示例:删除指标名node_network_receive开头的标签
metric_relabel_configs:
- source_labels: [__name__]
 regex: 'node_network_receive.*'
 action: drop

#示例:替换
metric_relabel_configs:
- source_labels:
 regex: '/.*'
 replacement: '123456'
target_label: replace_idscrape_configs:
...
- job_name: 'consul'
honor_labels: true #如果抓取的原有标签和Prometheus配置的标签冲突,保留原有标签,避免标签覆
盖
consul_sd_configs:
- server: 'consul-node1.wang.org:8500'
services: [] #指定需要发现的service名称,默认为所有service,或者如下面两行指定只从
consul中加载特定的service
#tags: #可以过滤具有指定的tag的service
#- "service"
#refresh_interval: 2m #刷新时间间隔,默认30s
- server: 'consul-node2.wang.org:8500' #添加其它两个节点实现冗余
- server: 'consul-node3.wang.org:8500' #添加其它两个节点实现冗余
relabel_configs:
- source_labels: ['__meta_consul_service'] #基于source_labels的值赋值给新的标签
consul_service
target_label: 'consul_service'
- source_labels: ['__meta_consul_dc'] #基于source_labels的值赋值给新的标签
datacenter
target_label: 'datacenter'
- source_labels: ['__meta_consul_tags'] #基于source_labels的值赋值给新的标签app
target_label: 'app'
- source_labels: ['__meta_consul_service'] #删除consul的service,此service是consul
内置,但并不提供metrics数据
regex: "consul"
action: drop6.记录和告警规则
rule_files:
 - "first_rules.yml"
 - "second_rules.yml"
 - "../rules/*.yml"

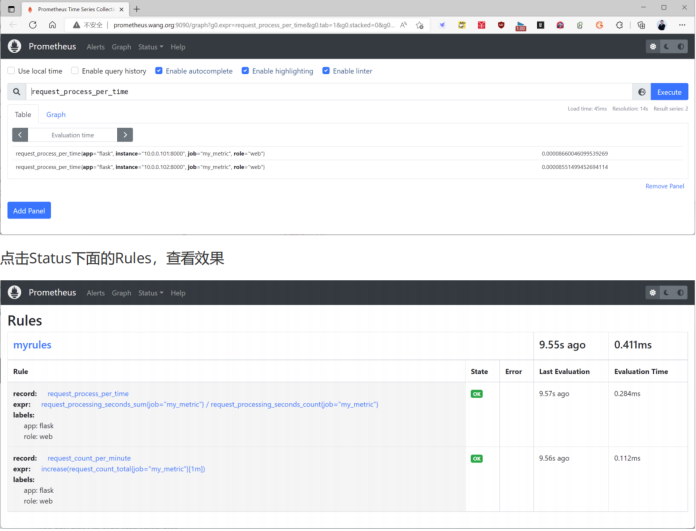
#注意: 如果用相对路径是指相对于prometheus.yml配置文件的路径记录规则实现:vim /etc/prometheus/prometheus_record_rules.yml
groups:
  - name: myrules
    # 规则组说明:针对Flask应用的自定义监控指标规则
    rules:
      # 规则1:计算每次请求的平均处理时间
      - record: "request_process_per_time"
        expr: request_processing_seconds_sum{job="my_metric"} / request_processing_seconds_count{job="my_metric"}
        labels:
          app: "flask"       # 应用标识
          role: "web"        # 角色标识

      # 规则2:计算每分钟的请求数量
      - record: "request_count_per_minute"
        expr: increase(request_count_total{job="my_metric"}[1m])
        labels:
          app: "flask"       # 应用标识
          role: "web"        # 角色标识

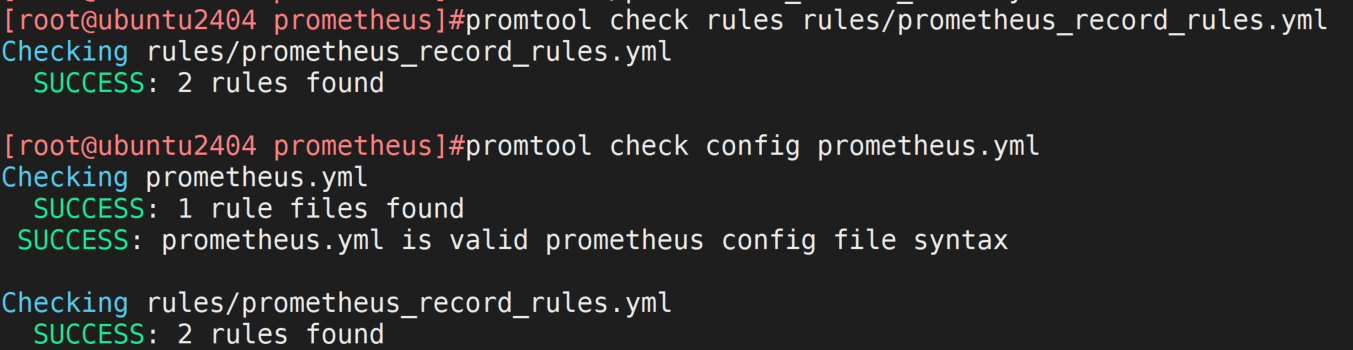
检查rule和全局配置文件
vim /etc/prometheus/rules/mysql_record_rules.yml
groups:
- name: mysqld_rules
 rules:
  # Record slave lag seconds for pre-computed timeseries that takes
  # `mysql_slave_status_sql_delay` into account
  - record: instance:mysql_slave_lag_seconds
   expr: mysql_slave_status_seconds_behind_master - mysql_slave_status_sql_delay

  # Record slave lag via heartbeat method
  - record: instance:mysql_heartbeat_lag_seconds
   expr: mysql_heartbeat_now_timestamp_seconds -
mysql_heartbeat_stored_timestamp_seconds

  - record: job:mysql_transactions:rate5m
   expr: sum without (command) (rate(mysql_global_status_commands_total{command=~"
(commit|rollback)"}[5m]))
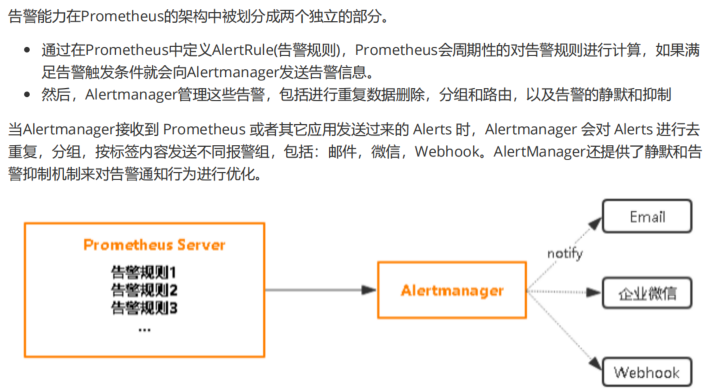
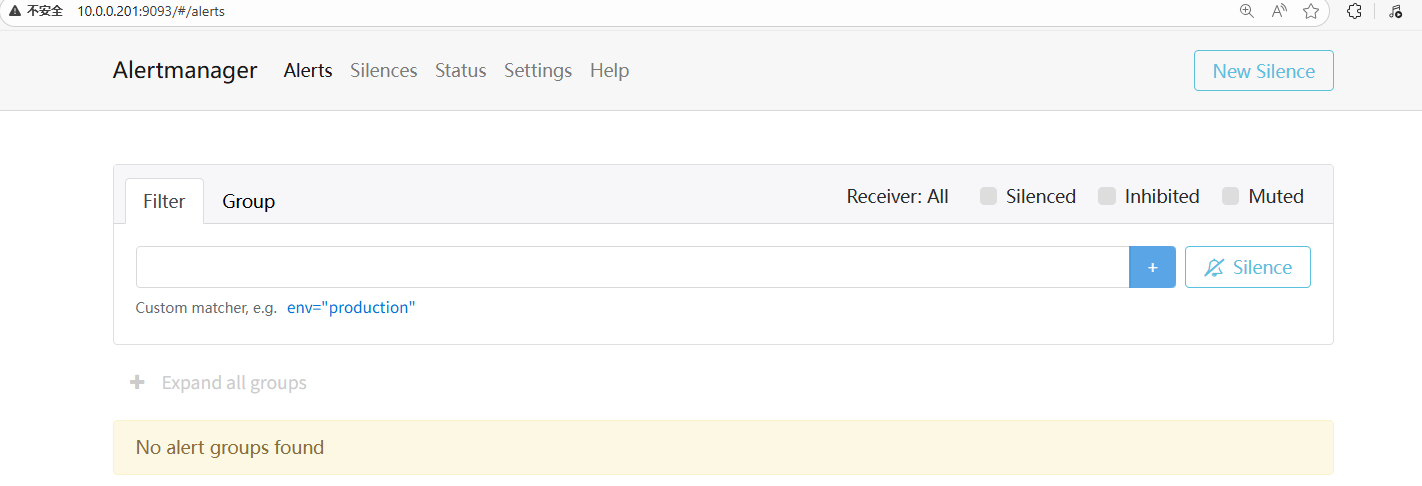
①告警说明和 Alertmanager 部署

alerting:
 alertmanagers:
  - static_configs:
- targets: ["10.0.0.201:9093"]方式2:文件发现 vim /etc/prometheus/prometheus.yml
alerting:
 alertmanagers:
  - file_sd_configs:
    - "targets/alertmanager*.yaml"
vim /etc/prometheus/targets/alertmanager.yaml
- targets:
  - alert.wang.org:9093
 labels:
   app: alertmanager
job: alertmanager#方式1:静态配置
]# vim /usr/local/prometheus/conf/prometheus.yml
scrape_configs:
- job_name: "alertmanager"
static_configs:
- targets: ["alertmanager.wang.org:9093"]
#方式2:文件发现
]# vim /usr/local/prometheus/conf/prometheus.yml
scrape_configs:
- job_name: "alertmanager"
file_sd_configs:
- files:
- targets/alertmanager.yaml
]# vim /usr/local/prometheus/conf/targets/alertmanager.yaml
- targets:
- alert.wang.org:9093
labels:
app: alertmanager
job: alertmanager 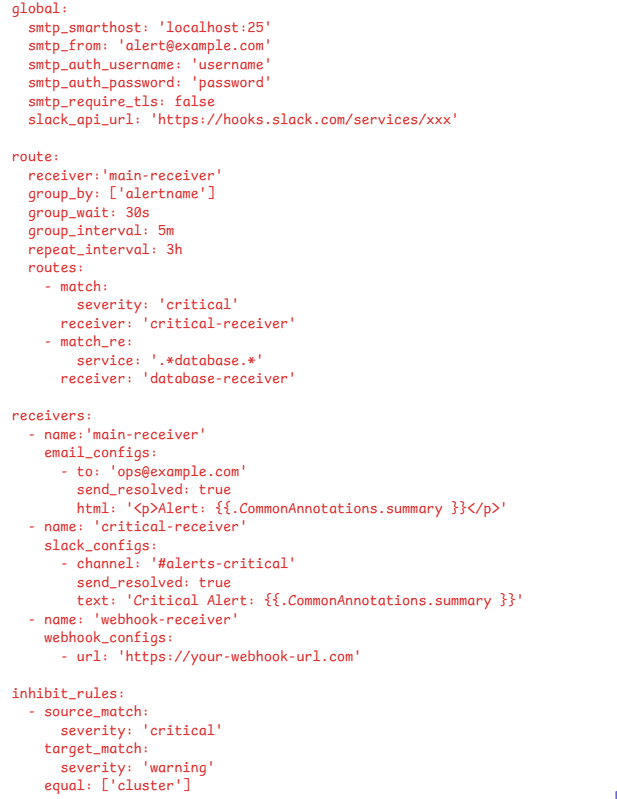
②Alertmanager 启用邮件告警

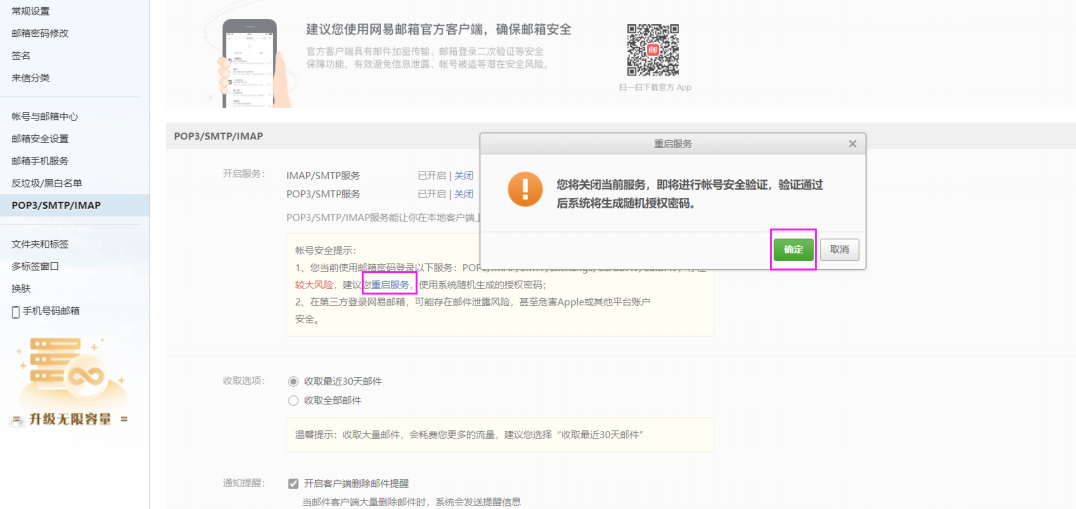
#当前QQ邮箱有异常,建议使用163的非加密形式
[root@ubuntu2404 ~]#cat /usr/local/alertmanager/conf/alertmanager.yml
global:
 resolve_timeout: 5m
 smtp_smarthost: 'smtp.163.com:25'           #基于全局块指定发件人信息,此处设为25,如果465
还需要添加tls相关配置
 smtp_from: 'lbtooth@163.com'
 smtp_auth_username: 'lbtooth@163.com'
 smtp_auth_password: 'xxxxxxxxxxxxxxxxxxxxxxxxx'
 smtp_hello: '163.com'
 smtp_require_tls: false        #启用tls安全,默认true,此处设为false
# 路由配置
route:
 group_by: ['alertname', 'cluster']
 group_wait: 10s
 group_interval: 10s
 repeat_interval: 10s  #此值不要过低,否则短期内会收到大量告警通知
 receiver: 'email'     #指定接收者名称
# 收信人员
receivers:
- name: 'email'
 email_configs:
  - to: 'root@xiaoming.com'
   send_resolved: true           #问题解决后也会发送恢复通知
③告警规则
④告警规则案例: 邮件告警
#确认包含rules目录中的yml文件
cat /usr/local/prometheus/conf/prometheus.yml
rule_files:
  - "../rules/*.yml"
#准备告警rule文件
vim /usr/local/prometheus/rules/prometheus_alert_rules.yml
groups:
- name: flask_web
 rules:
  - alert: InstanceDown
   expr: up{job="my_metric"} == 0
    #expr: up == 0     #所有targets
    for: 1m
   labels:
     severity: 1
   annotations:
      #title: Instance Down
     summary: "Instance {{ $labels.instance }} 停止工作"
     description: "{{ $labels.instance }} job {{ $labels.job }} 已经停止1m以上"

#属性解析:
- name: flask_web  #指定分组名称,在一个组中可以有多个 alert ,只要其中一个alert条件满足,就会触发
告警
{{ $labels.<labelname> }} 要插入触发元素的标签值
{{ $value }} 要插入触发元素的数值表达式值
#这里的$name 都是来源于模板文件中的定制内容,如果不需要定制的变动信息,可以直接写普通的字符串
#检查语法
promtool check rules prometheus_alert_rules.yml

#重启prometheus服务
systemctl reload prometheus.service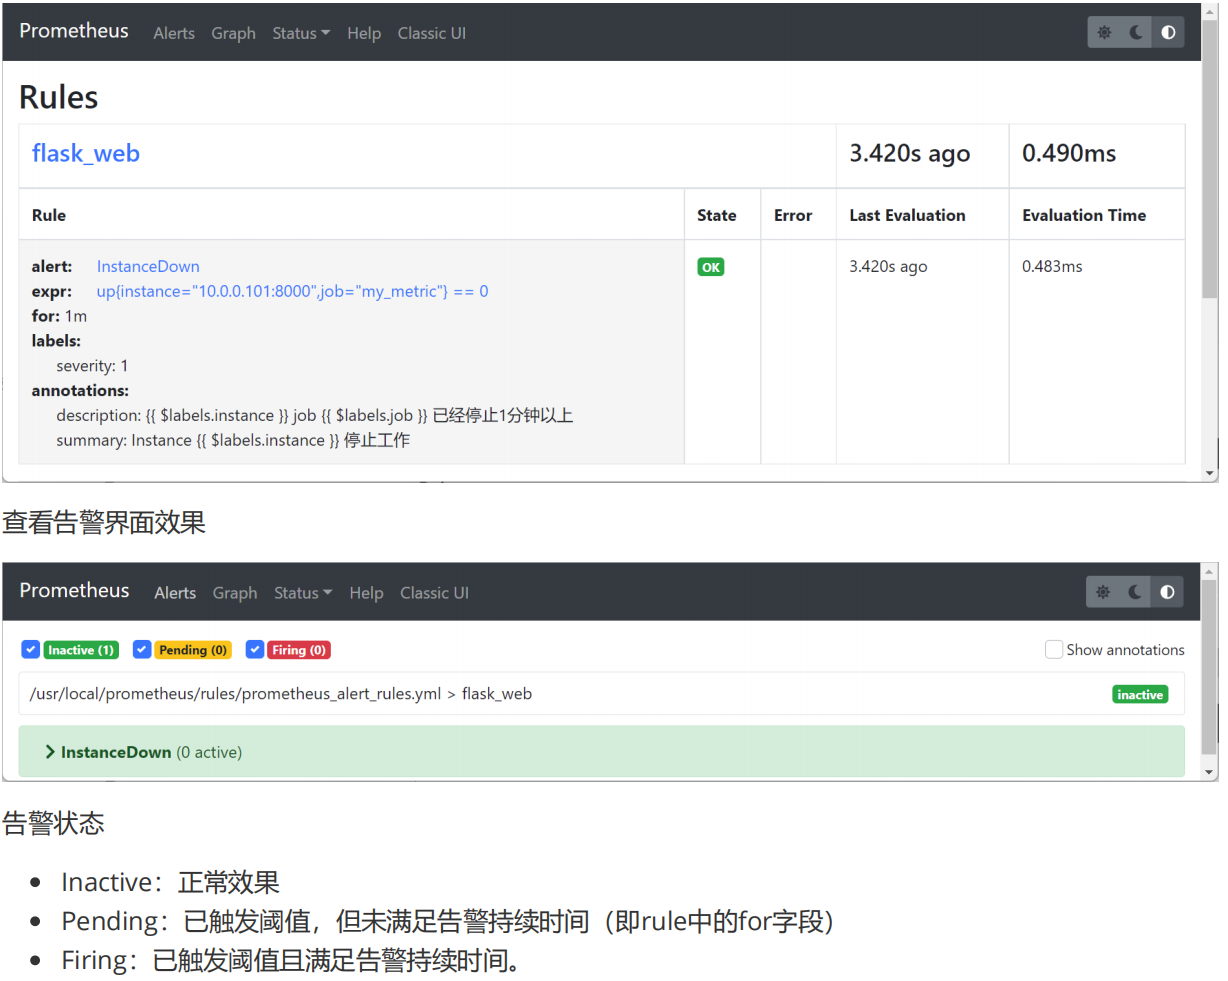
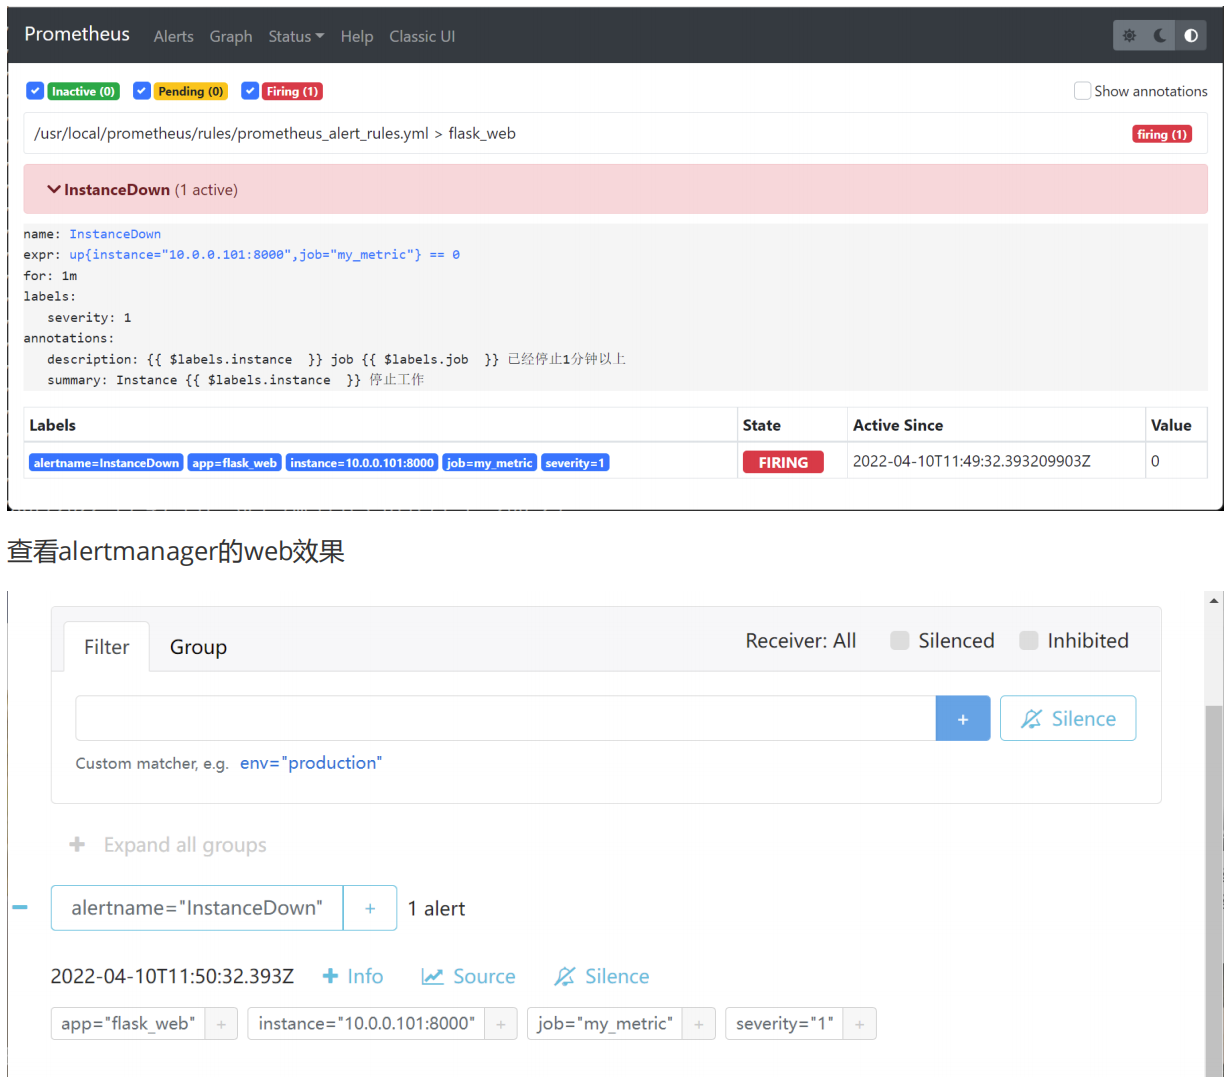
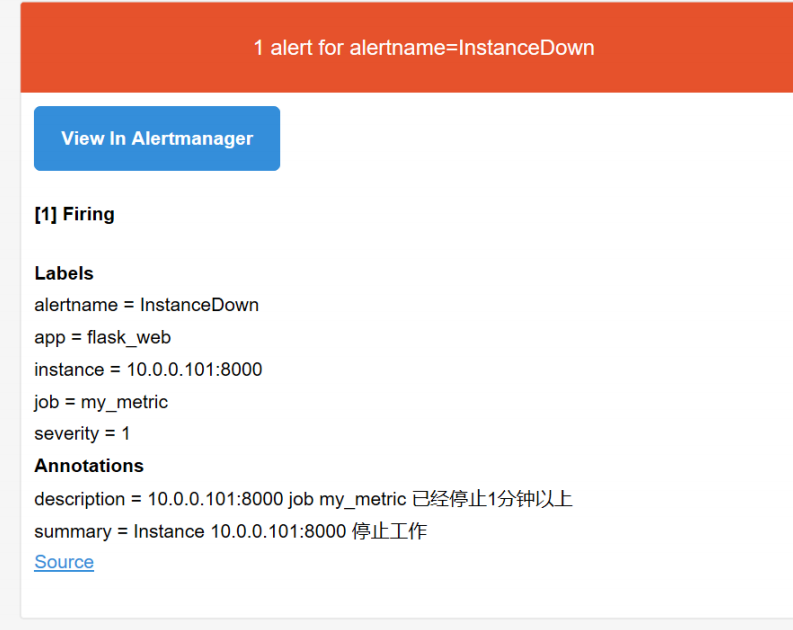
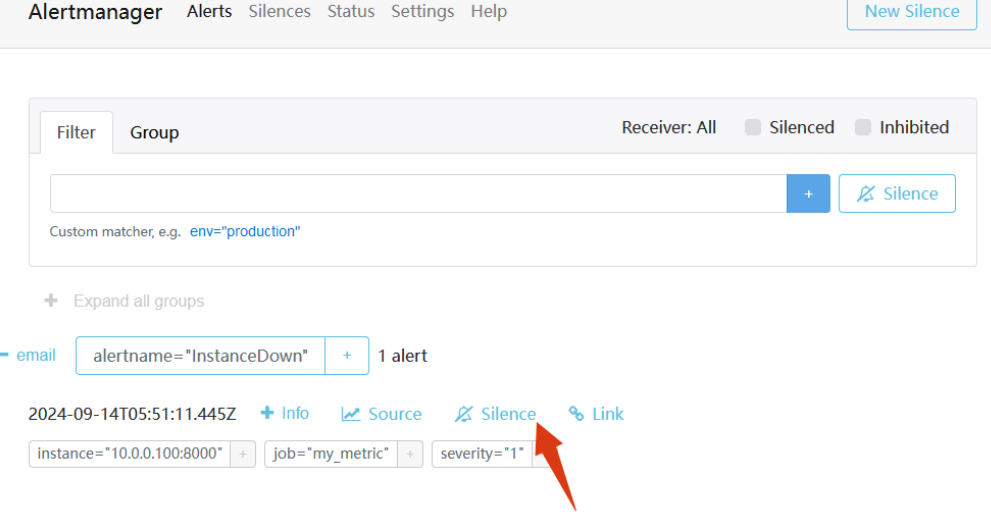
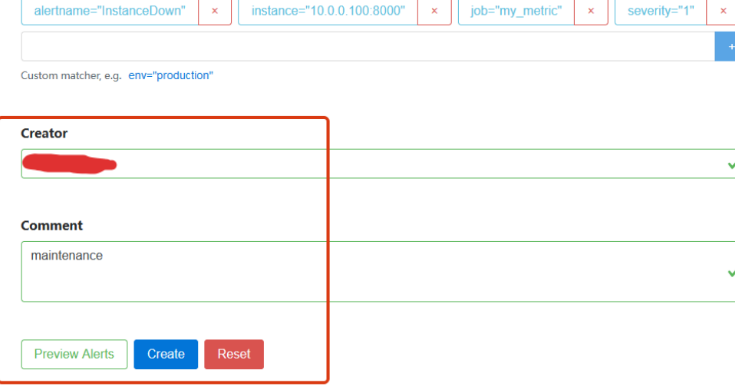
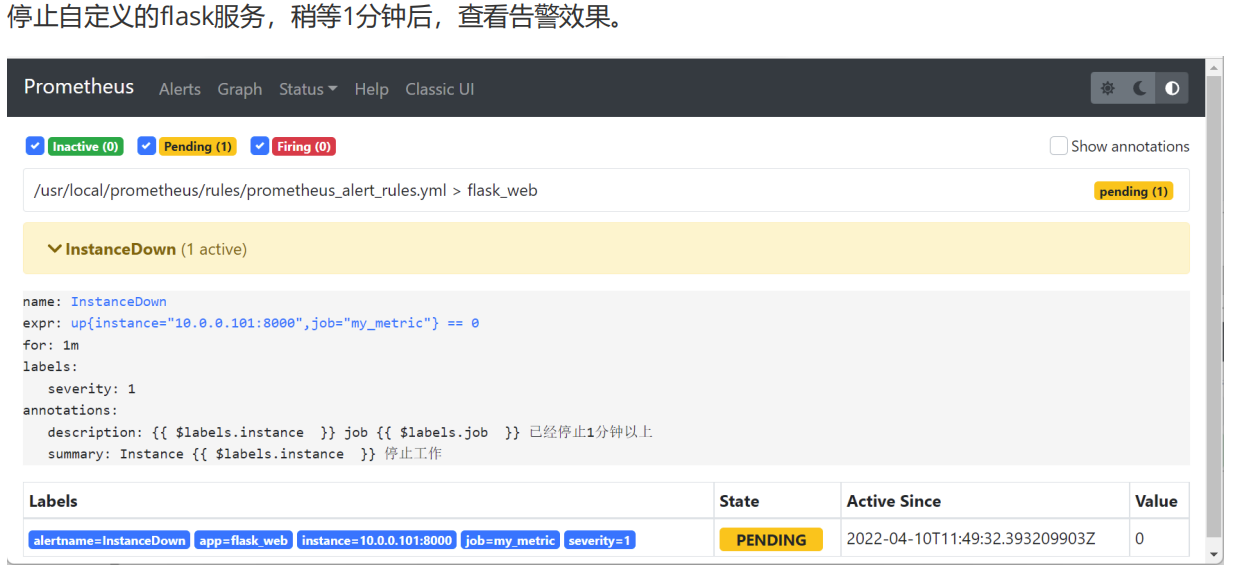 等待时间超过
for
持续的标准后,就会改变告警的状态,效果如下
等待时间超过
for
持续的标准后,就会改变告警的状态,效果如下
⑤定制模板案例
vim /usr/local/alertmanager/tmpl/email_template.tmpl
{{ define "email.html" }}
{{- if gt (len .Alerts.Firing) 0 -}}
{{ range .Alerts }}
=========start==========<br>
告警程序: prometheus_alert <br>
告警级别: {{ .Labels.severity }} <br>
告警类型: {{ .Labels.alertname }} <br>
告警主机: {{ .Labels.instance }} <br>
告警主题: {{ .Annotations.summary }} <br>
告警详情: {{ .Annotations.description }} <br>
触发时间: {{ .StartsAt.Format "2006-01-02 15:04:05" }} <br>
=========end==========<br>
{{ end }}{{ end -}}
{{- if gt (len .Alerts.Resolved) 0 -}}
{{ range .Alerts }}
=========start==========<br>
告警程序: prometheus_alert <br>
告警级别: {{ .Labels.severity }} <br>
告警类型: {{ .Labels.alertname }} <br>
告警主机: {{ .Labels.instance }} <br>
告警主题: {{ .Annotations.summary }} <br>
告警详情: {{ .Annotations.description }} <br>
触发时间: {{ .StartsAt.Format "2006-01-02 15:04:05" }} <br>
恢复时间: {{ .EndsAt.Format "2006-01-02 15:04:05" }} <br>
=========end==========<br>
{{ end }}{{ end -}}
{{- end }}
应用模版
]# vim /usr/local/alertmanager/conf/alertmanager.yml
global:
...
templates:            #加下面两行加载模板文件
  - '../tmpl/*.tmpl'  #相对路径是相对于altermanager.yml文件的路径
...
# 收信人员
receivers:
- name: 'email'
 email_configs:
  - to: 'root@xiaoming.com'
   send_resolved: true
   headers: { Subject: "[WARN] 报警邮件"}   #添加此行,定制邮件标题
   html: '{{ template "test.html" . }}'    #添加此行,调用模板显示邮件正文
    #html: '{{ template "email.html" . }}'   #添加此行,调用模板显示邮件正文
然后再重启prometheus进行验证
⑥告警路由
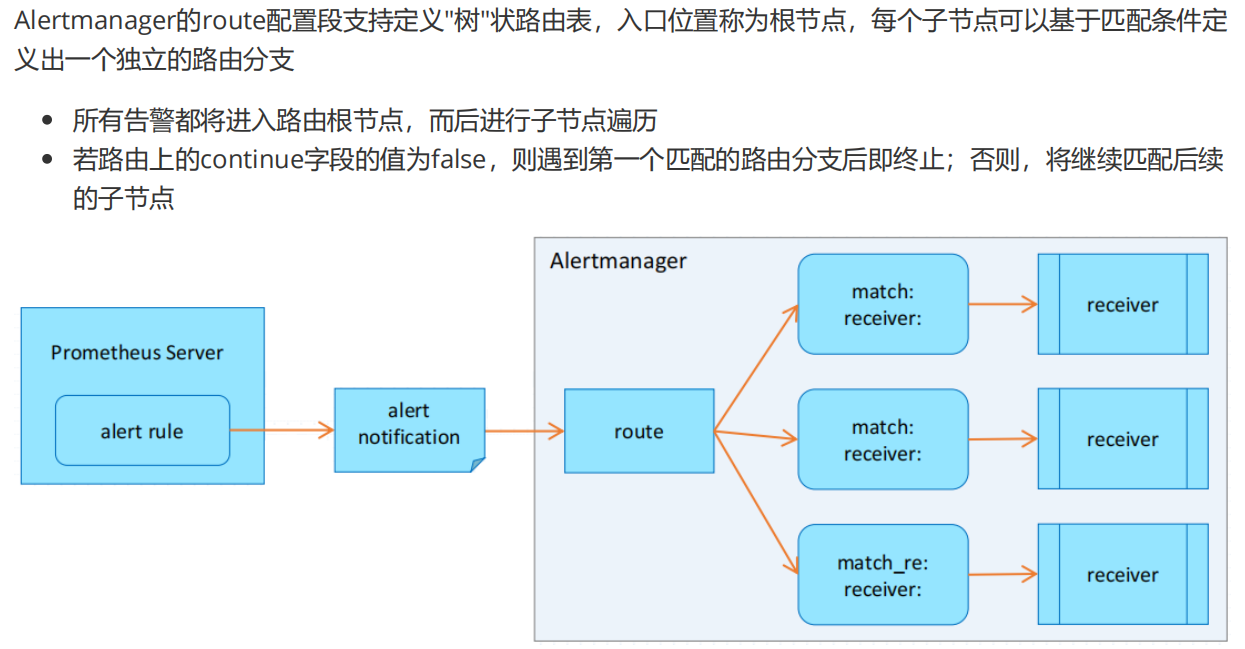
#准备prometheus配置文件
grep -Ev '^$|^ *#' /usr/local/prometheus/conf/prometheus.yml
global:
 scrape_interval: 15s # Set the scrape interval to every 15 seconds. Default is
every 1 minute.
 evaluation_interval: 15s # Evaluate rules every 15 seconds. The default is every 1
minute.
alerting:
 alertmanagers:
    - static_configs:
        - targets:
            - 10.0.0.100:9093  #指定alertmaanager地址
rule_files:
  - "../rules/*.yml"           #指定规则文件路径
scrape_configs:
  - job_name: "prometheus"
   static_configs:
      - targets: ["localhost:9090"]
  - job_name: 'node_exporter'
   static_configs:
    - targets: ['10.0.0.101:9100','10.0.0.102:9100','10.0.0.103:9100']
     labels: {app: 'k8s-node'}
  - job_name: 'my_metric'
   static_configs:
    - targets: ['10.0.0.101:8000']
     labels: {app: 'flask_web'}
#配置告警规则
vim /usr/local/prometheus/rules/prometheus_alert_route.yml
groups:
- name: flask_web
rules:
- alert: InstanceDown
expr: up{job="my_metric"} == 0
for: 1m
labels:
severity: critical
annotations:
summary: "Instance {{ $labels.instance }} 停止工作"
description: "{{ $labels.instance }} job {{ $labels.job }} 已经停止1分钟以上"
value: "{{$value}}"
- name: flask_QPS
rules:
- alert: InstanceQPSIsHight
expr: increase(request_count_total{job="my_metric"}[1m]) > 500
5.5.2.2 定制路由分组
for: 1m
labels:
severity: warning
annotations:
summary: "Instance {{ $labels.instance }} QPS 持续过高"
description: "{{ $labels.instance }} job {{ $labels.job }} QPS 持续过高"
value: "{{$value}}"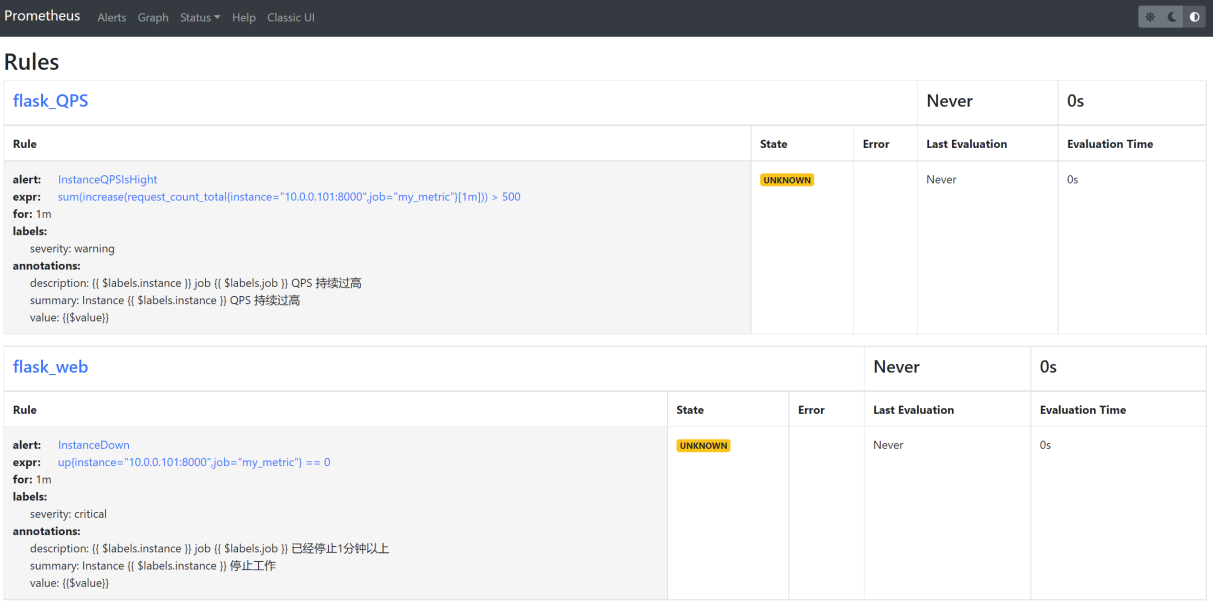
#指定路由分组
vim /usr/local/alertmanager/conf/alertmanager.yml
# 全局配置
global:
 resolve_timeout: 5m
 smtp_smarthost: 'smtp.qq.com:25'
 smtp_from: '123456@qq.com'
 smtp_auth_username: '123456@qq.com'
 smtp_auth_password: 'abefxqzcnxhqaebieb'
 smtp_hello: 'qq.com'
 smtp_require_tls: false
# 模板配置
templates:
  - '../tmpl/*.tmpl'
# 路由配置
#新版:使用指令matchers替换match和match_re,如下示例
route:
 group_by: ['instance', 'cluster']
 group_wait: 10s
 group_interval: 10s
 repeat_interval: 10s
 receiver: 'email'
 routes:
  - receiver: 'leader-team'
   matchers:
    - severity = "critical"
  - receiver: 'ops-team'
   matchers:
    - severity =~ "^(warning)$"
 #子路由
  #- matchers
  # - severity = "critical"
  # - job =~ "mysql|java"
  # receiver: 'leader-team'
  # routes: #支持routes嵌套和分级
  # - matchers:
  #   - job =~ "mysql"
  #   receiver: 'dba-team'
  #- matchers
  # - severity =~ "warning"
  # - job = "node_exporter"
  # receiver: 'ops-team'

# 收信人员
receivers:
- name: 'email'
 email_configs:
  - to: 'root@wangxiaochun.com'
   send_resolved: true
   html: '{{ template "test.html" . }}'
   headers: { Subject: "[WARN] 报警邮件"}
- name: 'leader-team'
 email_configs:
  - to: 'root@wangxiaochun.com'
   html: '{{ template "test.html" . }}'
   headers: { Subject: "[CRITICAL] 应用服务报警邮件"}
   send_resolved: true  #
- name: 'ops-team'
 email_configs:
  - to: 'root@xiaoming.com'
   html: '{{ template "test.html" . }}'
   headers: { Subject: "[WARNNING] QPS负载报警邮件"}
   send_resolved: true

#检查语法
amtool check-config /usr/local/alertmanager/conf/alertmanager.yml⑦ 告警抑制
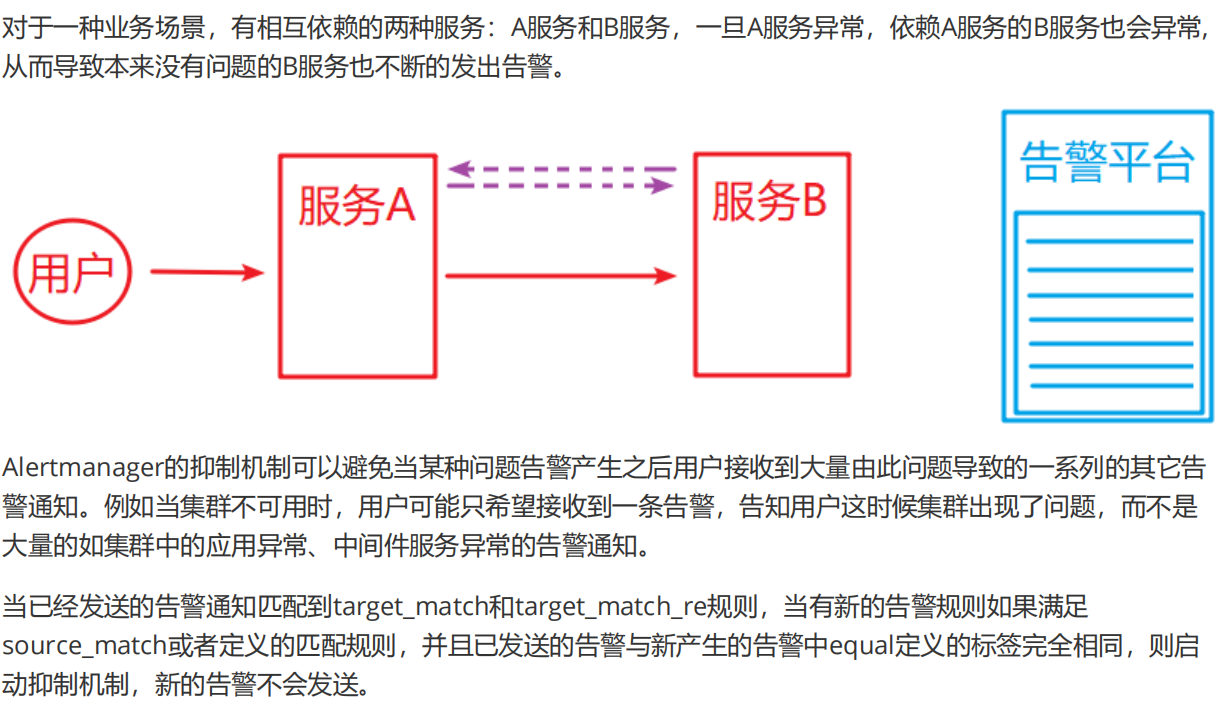
在alertmanager里面添加下面的代码
# 抑制措施
inhibit_rules:
- source_match:
   severity: critical     #被依赖的告警服务
 target_match:
   severity: warning      #依赖的告警服务
 equal:
    - instance

#重启alertmanager服务
systemctl reload alertmanager.service7.Alertmanager 高可用
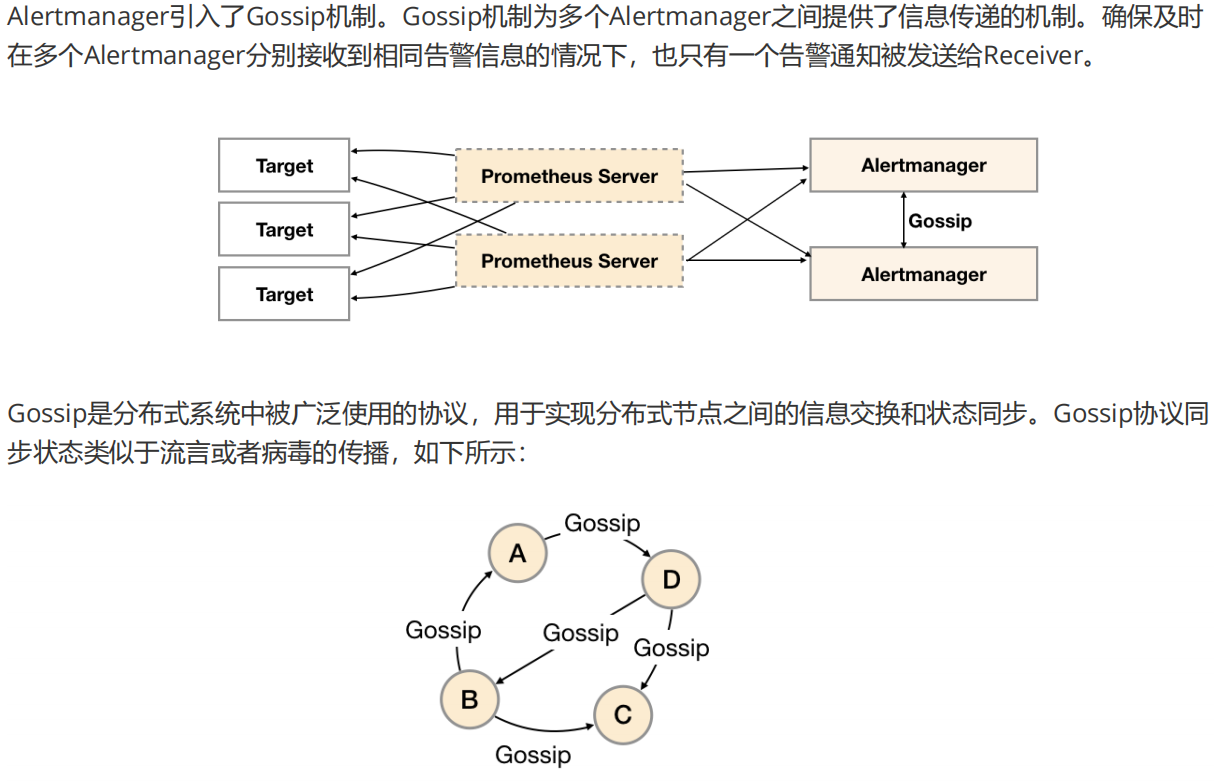
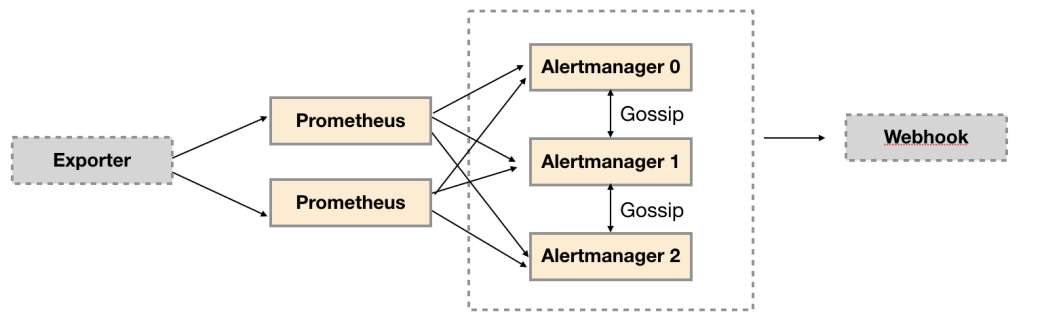
#创建Alertmanager配置文件/etc/prometheus/alertmanager-ha.yml, 为了验证Alertmanager的集群
行为,这里在本地启动一个webhook服务用于打印Alertmanager发送的告警通知信息。
route:
 receiver: 'default-receiver'
receivers:
  - name: default-receiver
   webhook_configs:
    - url: 'http://127.0.0.1:5001/'

# 获取alertmanager提供的webhook示例,如果该目录下定义了main函数,go get会自动将其编译成可执行文件
go get github.com/prometheus/alertmanager/examples/webhook
export PATH=$GOPATH/bin:$PATH  # 设置环境变量指向GOPATH的bin目录
webhook  # 启动服务

#a1:
alertmanager  --web.listen-address=":9093" --cluster.listen-address="127.0.0.1:8001"
--config.file=/etc/prometheus/alertmanager-ha.yml  --storage.path=/data/alertmanager/
--log.level=debug
#a2:
alertmanager  --web.listen-address=":9094" --cluster.listen-address="127.0.0.1:8002"
--cluster.peer=127.0.0.1:8001 --config.file=/etc/prometheus/alertmanager-ha.yml  --
storage.path=/data/alertmanager2/ --log.level=debug
#a3:
alertmanager  --web.listen-address=":9095" --cluster.listen-address="127.0.0.1:8003"
--cluster.peer=127.0.0.1:8001 --config.file=/etc/prometheus/alertmanager-ha.yml  --
storage.path=/data/alertmanager2/ --log.level=debug


#创建Promthues集群配置文件/etc/prometheus/prometheus-ha.yml,完整内容如下:
global:
 scrape_interval: 15s
 scrape_timeout: 10s
 evaluation_interval: 15s
rule_files:
  - /etc/prometheus/rules/*.rules
alerting:
 alertmanagers:
  - static_configs:
    - targets:
      - 127.0.0.1:9093
      - 127.0.0.1:9094
      - 127.0.0.1:9095
scrape_configs:
- job_name: prometheus
 static_configs:
  - targets:
    - localhost:9090
- job_name: 'node'
 static_configs:
  - targets: ['localhost:9100']


#同时定义告警规则文件/etc/prometheus/rules/hoststats-alert.rules,如下所示:
groups:
- name: hostStatsAlert
 rules:
  - alert: hostCpuUsageAlert
   expr: sum(avg without (cpu)(irate(node_cpu{mode!='idle'}[5m]))) by (instance) *
100 > 50
    for: 1m
   labels:
     severity: page
   annotations:
     summary: "Instance {{ $labels.instance }} CPU usgae high"
     description: "{{ $labels.instance }} CPU usage above 50% (current value: {{
$value }})"
  - alert: hostMemUsageAlert
   expr: (node_memory_MemTotal - node_memory_MemAvailable)/node_memory_MemTotal *
100 > 85
    for: 1m
   labels:
     severity: page
   annotations:
     summary: "Instance {{ $labels.instance }} MEM usgae high"
     description: "{{ $labels.instance }} MEM usage above 85% (current value: {{
$value }})"

#创建prometheus.procfile文件,创建两个Promthues节点,分别监听9090和9091端口:
#p1:
prometheus --config.file=/etc/prometheus/prometheus-ha.yml --
storage.tsdb.path=/data/prometheus/ --web.listen-address="127.0.0.1:9090"
#p2:
prometheus --config.file=/etc/prometheus/prometheus-ha.yml --
storage.tsdb.path=/data/prometheus2/ --web.listen-address="127.0.0.1:9091"
#node_exporter
node_exporter: node_exporter -web.listen-address="0.0.0.0:9100"docker run -d \
-p 8080:8080 \
-e PA_LOGIN_USER=prometheusalert \
-e PA_LOGIN_PASSWORD=prometheusalert \
-e PA_TITLE=PrometheusAlert \
-e PA_OPEN_FEISHU=1 \
-e PA_OPEN_DINGDING=1 \
-e PA_OPEN_WEIXIN=1 \
feiyu563/prometheus-alert:latest
#浏览器访问,用户名/密码默认是prometheusalert/prometheusalert
http://prometheusalert.wang.org:8080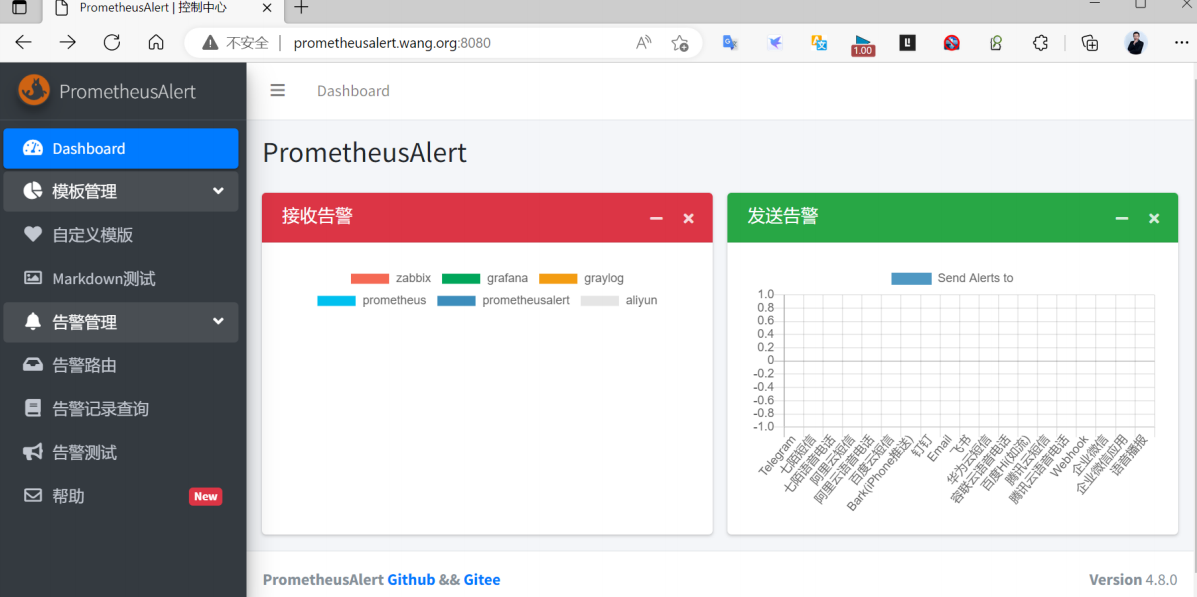
8.服务发现
- job_name: 'node_exporter'
   static_configs:
    - targets: ['10.0.0.101:9100']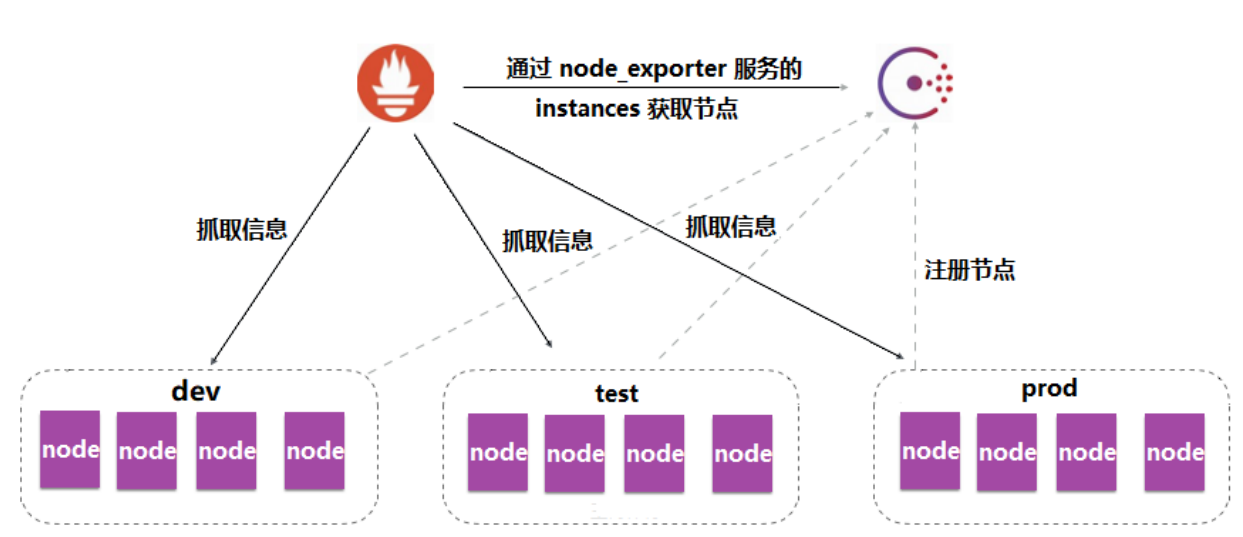
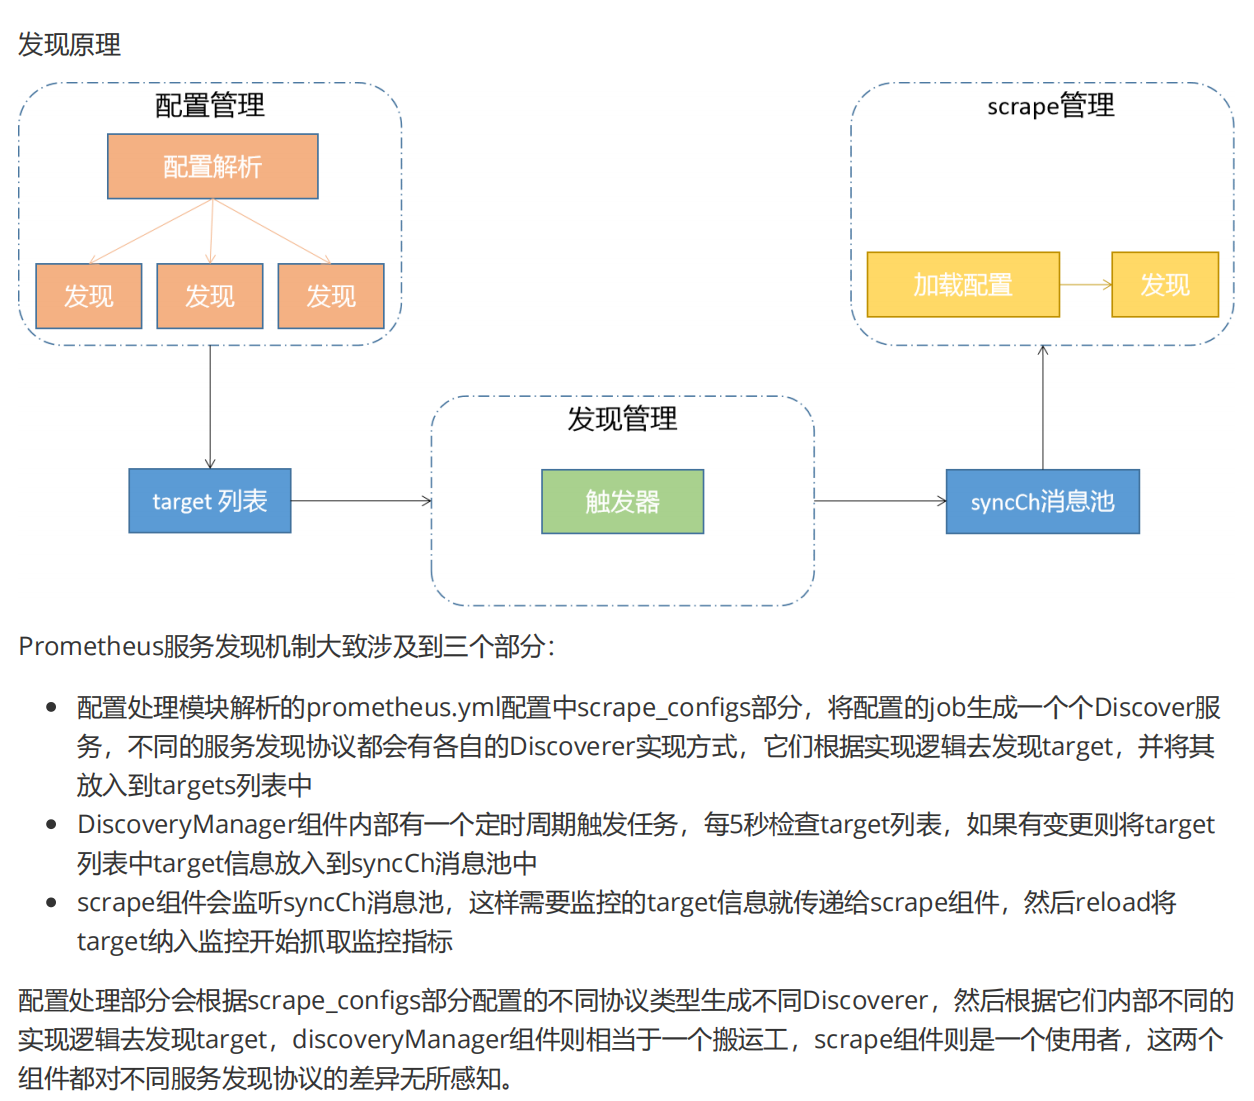
#创建目标目录
mkdir /usr/local/prometheus/conf/targets
cd /usr/local/prometheus/conf/targets

#添加linux主机目标
ls /usr/local/prometheus/conf/targets/
prometheues-flask.yml prometheues-node.yml prometheues-server.yml

#创建prometheus的服务配置
cat prometheues-server.yml
- targets:
  - 10.0.0.101:9090
 labels:
   app: prometheus-server
   job: prometheus-server

cat prometheues-node.yml
- targets:
  - 10.0.0.101:9100
 labels:
   app: prometheus
   job: prometheus
- targets:
  - 10.0.0.104:9100
  - 10.0.0.105:9100
 labels:
   app: node-exporter
   job: node
cat prometheues-flask.yml
- targets:
  - 10.0.0.101:8000
 labels:
   app: flask-web
   job: prometheus-flask

#修改prometheus的配置文件,让它自动加载文件中的节点信息
cd /usr/local/prometheus/conf
cp prometheus.yml{,.bak}

#编辑配置文件
#cat /usr/local/prometheus/conf/prometheus.yml(全局配置)
global:
 scrape_interval: 15s # Set the scrape interval to every 15 seconds. Default is
every 1 minute.
 evaluation_interval: 15s # Evaluate rules every 15 seconds. The default is every 1
minute.
  # scrape_timeout is set to the global default (10s).
# Alertmanager configuration
alerting:
 alertmanagers:
    - static_configs:
        - targets:
rule_files:
scrape_configs:
  - job_name: "file_sd_prometheus"
   scrape_interval: 10s  #指定抓取数据的时间间隔
   file_sd_configs:
    - files:
      - targets/prometheues-server.yml
     refresh_interval: 10s  #指定重读文件的时间间隔,默认值5m
  - job_name: 'file_sd_node_exporter'
   file_sd_configs:
    - files:
      - targets/prometheues-node.yml
     refresh_interval: 10s
  - job_name: 'file_sd_flask_web'
   file_sd_configs:
    - files:
      - targets/prometheues-flask.yml
     refresh_interval: 10s

#配置文件语法检查
promtool check config prometheus.yml

#重启服务
systemctl reload prometheus.service

#稍等几秒钟,到浏览器中查看监控目标
#结果显示:所有的节点都添加完毕了,而且每个节点都有自己的标签信息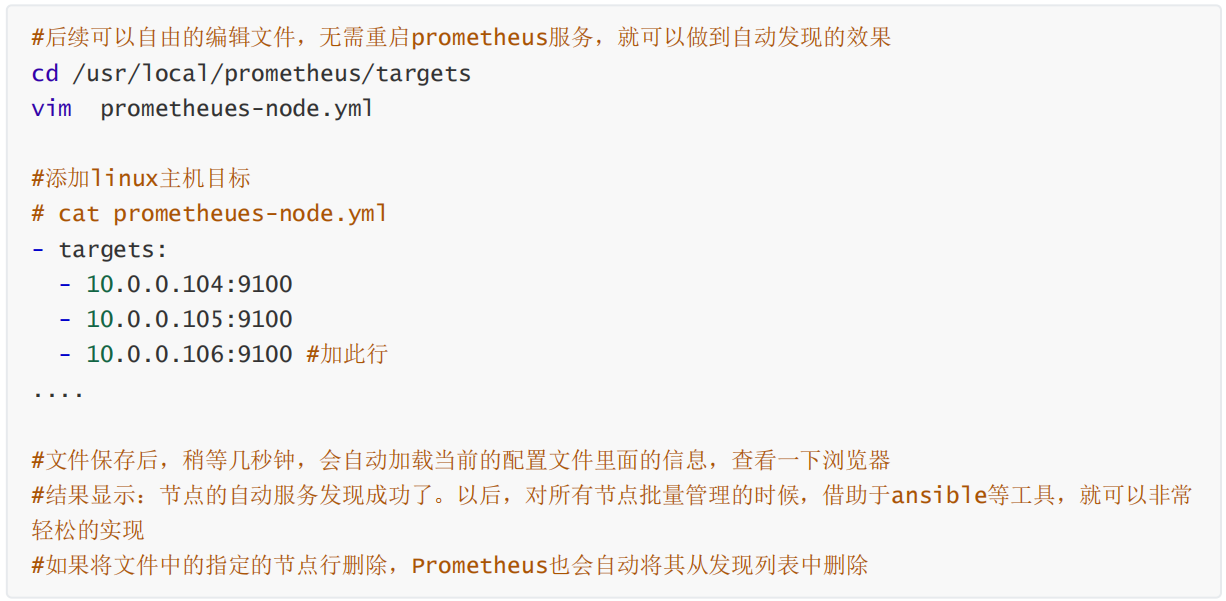
9.DNS 服务发现
#安装软件
apt update && apt -y install bind9 bind9utils bind9-doc bind9-host
named -v

#查看部署软件
dpkg -L bind9 | grep named.conf
/etc/bind/named.conf
/etc/bind/named.conf.default-zones
/etc/bind/named.conf.local
/etc/bind/named.conf.options

#定制正向解析zone的配置
cat >> /etc/bind/named.conf.default-zones
//定制网站主域名的zone配置
zone "wang.org" {
       type master;
       file "/etc/bind/wang.org.zone";
};

#定制主域名的zone文件
vim /etc/bind/wang.org.zone
;
; BIND reverse data file for local loopback interface
;
$TTL    604800
@       IN     SOA     ns.wang.org. admin.wang.org. (
                              1         ; Serial
                         604800         ; Refresh
                          86400         ; Retry
                        2419200         ; Expire
                         604800 )       ; Negative Cache TTL
;
       IN     NS     master
master IN     A       10.0.0.100
node1   IN     A       10.0.0.101
node2   IN     A       10.0.0.102
node3   IN     A       10.0.0.103
flask   IN     A       10.0.0.101

#检查配置文件
named-checkconf

#重启dns服务
rndc reload
systemctl restart named
systemctl status named

#配置prometheus服务器使用DNS域名服务器
vim /etc/netplan/01-netcfg.yaml
network:
 version: 2
 renderer: networkd
 ethernets:
   eth0:
     addresses:
      - 10.0.0.101/24
     gateway4: 10.0.0.2
     nameservers:
       search: [wang.org,wang.com]
       addresses: [10.0.0.100] #只保留当前的DNS服务器地址,别再加其它DNS服务器地址,否则DNS
解析有问题

#应用网络配置
netplan apply

#确认dns解析效果
dig node1.wang.org
host node1.wang.org
nslookup node1.wang.org#添加SRV记录
# vim /etc/bind/wang.org.zone
... ...
node1 IN A 10.0.0.101
node2 IN A 10.0.0.102
node3 IN A 10.0.0.103
flask IN A 10.0.0.101 #只有A记录
#添加下面的SRV记录,对应上面的三条A记录
_prometheus._tcp.wang.org. 1H IN SRV 10 10 9100 node1.wang.org.
_prometheus._tcp.wang.org. 1H IN SRV 10 10 9100 node2.wang.org.
_prometheus._tcp.wang.org. 1H IN SRV 10 10 9100 node3.wang.org.
#检查配置文件
named-checkconf
#生效
rndc reload
#测试解析
dig srv _prometheus._tcp.wang.org
host -t srv _prometheus._tcp.wang.org
nslookup -q=srv _prometheus._tcp.wang.org# vim /usr/local/prometheus/conf/prometheus.yml
...
scrape_configs:
- job_name: "prometheus"
.......
#添加下面所有行
- job_name: 'dns_sd_flask' #实现单个主机定制的信息解析,也支持DNS或/etc/hosts
文件实现解析
dns_sd_configs:
- names: ['flask.wang.org']
type: A #指定记录类型,默认SRV
port: 8000 #不是SRV时,需要指定Port号
refresh_interval: 10s
- job_name: 'dns_sd_node_exporter' #实现批量主机解析
dns_sd_configs:
- names: ['_prometheus._tcp.wang.org'] #SRV记录必须通过DNS的实现
refresh_interval: 10s #指定DNS资源记录的刷新间隔,默认30s
relabel_configs: #生成新的标签service,值为_prometheus._tcp
- source_labels: ['__meta_dns_name']
regex: '(.+?)\.wang\.org'
target_label: 'service'
replacement: '$1'
#重启prometheus
promtool check config /usr/local/prometheus/conf/prometheus.yml
systemctl reload prometheus验证结果
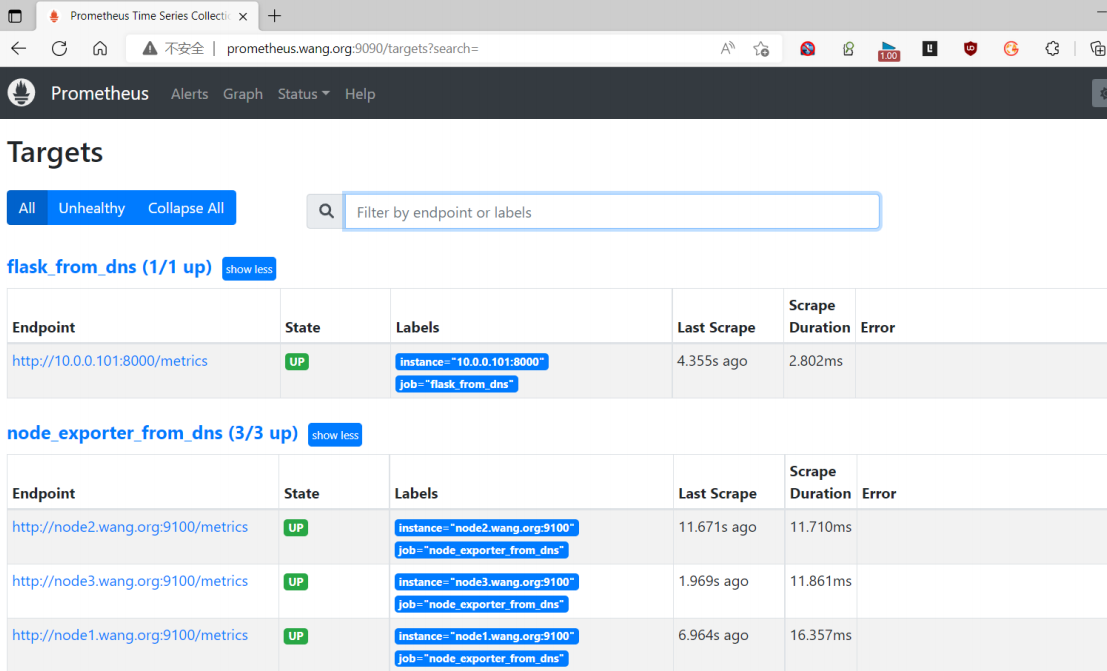
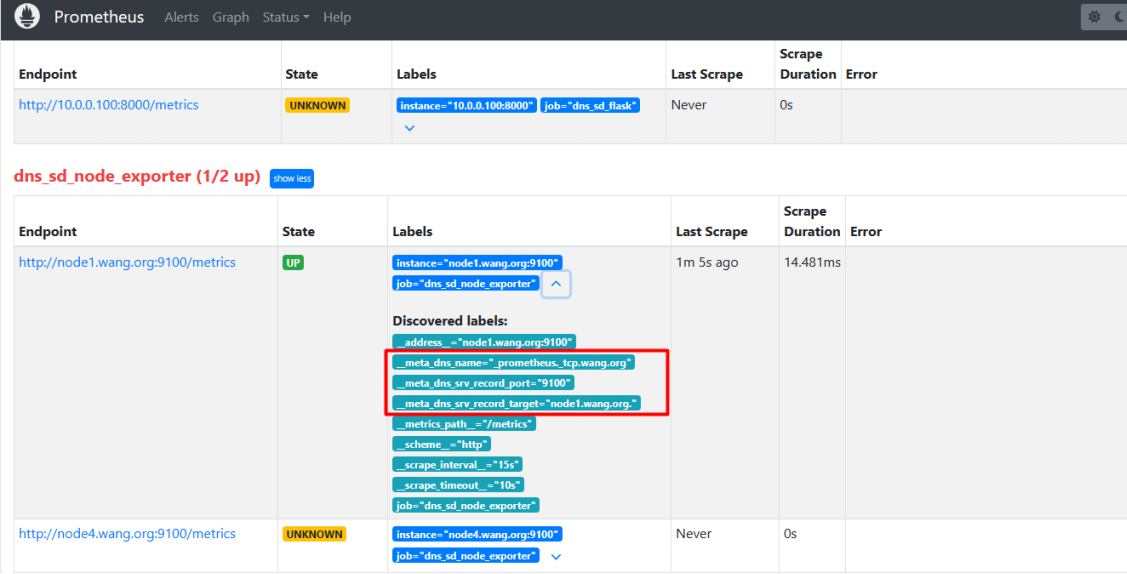
#删除node2和添加node4对应的SRV和A记录
[root@prometheus ~]#cat /etc/bind/wang.org.zone
$TTL 1D
@ IN SOA master admin (
 1 ; serial
 1D ; refresh
 1H ; retry
 1W ; expire
 3H ) ; minimum
           NS   master
master         A       10.0.0.100
node1   IN     A       10.0.0.101
node3   IN     A       10.0.0.103
node4   IN     A       10.0.0.104  #修改
flask   IN     A       10.0.0.101

_prometheus._tcp.wang.org. 1H IN SRV 10 10 9100 node1.wang.org.
_prometheus._tcp.wang.org. 1H IN SRV 10 10 9100 node3.wang.org.
_prometheus._tcp.wang.org. 1H IN SRV 10 10 9100 node4.wang.org. #修改

#注意:Ubuntu有DNS缓存,需要清除才能生效
[root@ubuntu2404 ~]#systemctl restart systemd-resolved.service
[root@prometheus ~]#rndc reload && netplan apply
server reload successful

#确认结果
[root@prometheus ~]#host -t srv _prometheus._tcp.wang.org
_prometheus._tcp.wang.org has SRV record 10 10 9100 node1.wang.org.
_prometheus._tcp.wang.org has SRV record 10 10 9100 node3.wang.org.
_prometheus._tcp.wang.org has SRV record 10 10 9100 node4.wang.org.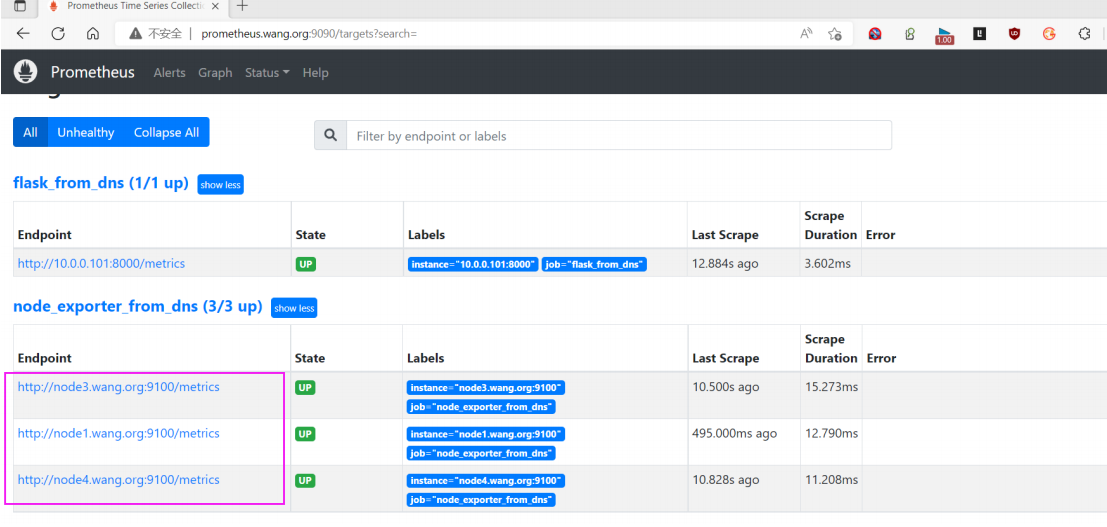
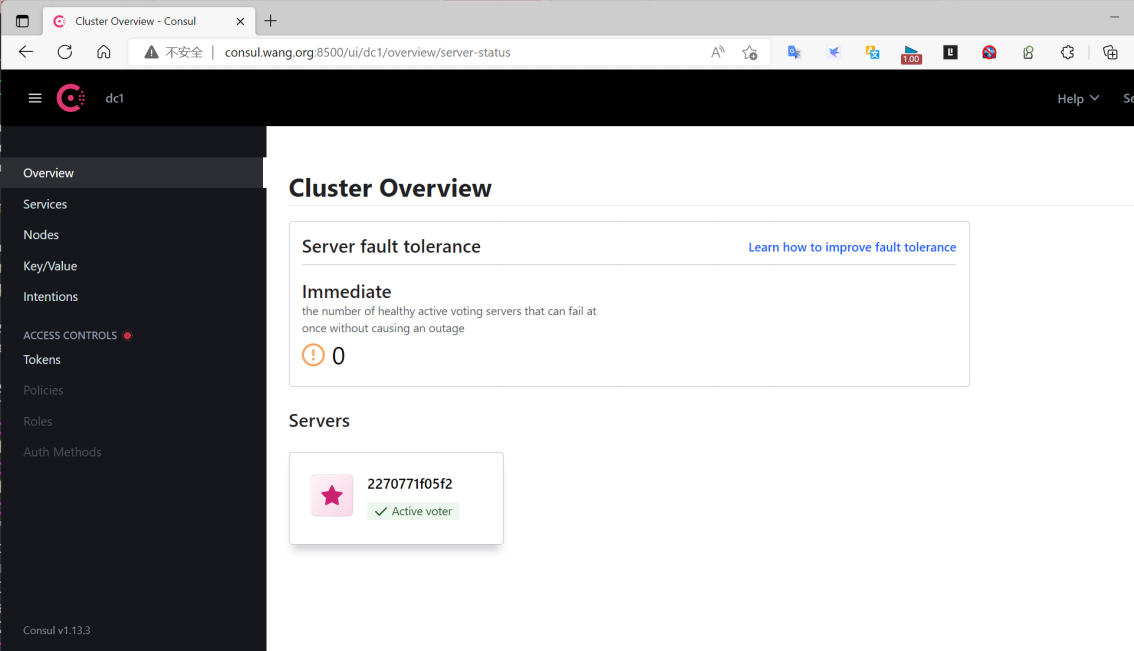
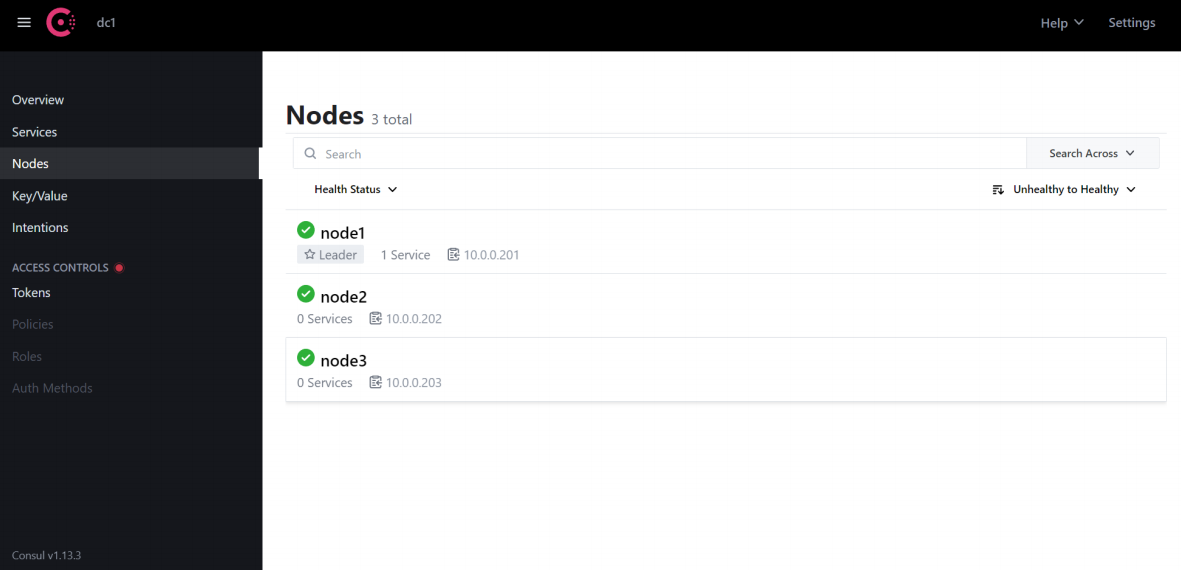
10.Consul 服务发现
11 各种 Exporter

码道开发者社区,聚焦华为云码道 CodeArts 代码智能体,沉淀 Agent、Skill、鸿蒙开发实战内容,供开发者查阅资料、交流技术、分享工程实践
更多推荐



 20
20 0
0- 0


 已为社区贡献5条内容

所有评论(0)