UCI数据集:论文中常用的uci数据集以及一百多个已 处理好的数据集,可以用于智能算法、机器学习、深 度学习等分类任务。
UCI数据集:论文中常用的uci数据集以及一百多个已
处理好的数据集,可以用于智能算法、机器学习、深
度学习等分类任务。
-含原始数据、预处理数据、归一化数据等,可直接
使用。
–并提供数据读取的matlab程序,可提取出特征类别
和样本。
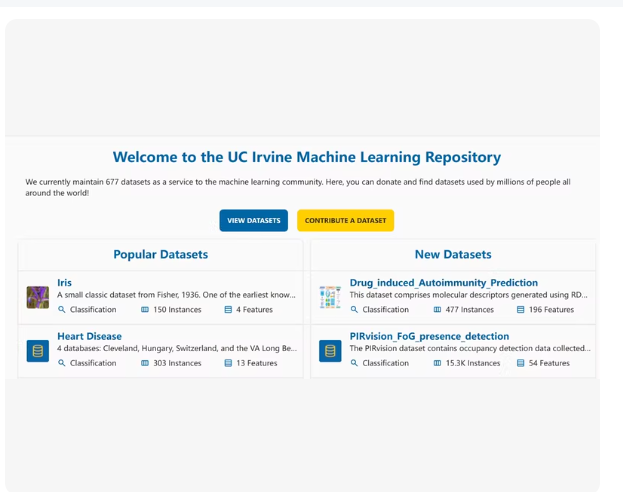
UCI 数据集通用读取与预处理 MATLAB 代码,适用于绝大多数 UCI 分类任务(如 Iris、Wine、Breast Cancer、Glass、Ionosphere 等),支持:
✅ 自动识别特征与标签
✅ 支持含表头/无表头、含类别字符串/纯数值的数据
✅ 提供原始数据、归一化数据、独热编码标签等输出
✅ 可直接用于智能算法、机器学习、深度学习分类任务
✅ 文件说明
load_uci_data.m:主函数,一键加载任意 UCI 格式数据集
支持格式:
.csv
.data
.txt
Excel(.xlsx)
自动处理:
缺失值(替换为 NaN 或删除)
字符串标签 → 数值标签(或 one-hot)
特征归一化(Min-Max / Z-score)
📄 load_uci_data.m —— 通用 UCI 数据加载函数
matlab
function [X, Y, X_norm, label_names, data_info] = load_uci_data(filepath, options)
% 加载UCI数据集,返回特征、标签、归一化特征等
%
% 输入:
% filepath : 数据文件路径(如 ‘iris.data’ 或 ‘breast_cancer.csv’)
% options : 可选结构体,控制行为(见下方默认值)
%
% 输出:
% X : 原始特征矩阵 (N×d)
% Y : 数值标签向量 (N×1),从1开始编号
% X_norm : 归一化后的特征(Min-Max 到 [0,1])
% label_names : 字符串标签名称(如 {‘setosa’,‘versicolor’,‘virginica’})
% data_info : 数据信息结构体
%% 默认参数
if nargin < 2
options = struct();
end
if ~isfield(options, ‘has_header’), options.has_header = ‘auto’; end
if ~isfield(options, ‘label_col’), options.label_col = ‘last’; end % ‘first’ or ‘last’
if ~isfield(options, ‘missing’), options.missing = ‘?’; end % 缺失值符号
if ~isfield(options, ‘normalize’), options.normalize = ‘minmax’; end % ‘minmax’ or ‘zscore’
%% 1. 读取原始数据
ext = lower(fileparts(filepath));
[~, ~, ext] = fileparts(filepath);
ext = lower(ext);
if strcmp(ext, ‘.xlsx’) strcmp(ext, ‘.xls’)
raw = readtable(filepath, ‘ReadVariableNames’, false);
raw = table2cell(raw);
else
% 尝试用 textscan 读取文本
fid = fopen(filepath, ‘rt’);
if fid == -1
error(‘无法打开文件: %s’, filepath);
end
% 自动检测分隔符
line1 = fgetl(fid);
fclose(fid);
if contains(line1, ‘,’)
delimiter = ‘,’;
elseif contains(line1, ‘\t’)
delimiter = ‘\t’;
else
delimiter = ’ '; % 空格或多个空格
end
% 读取所有行
try
raw = readmatrix(filepath, ‘Delimiter’, delimiter, ‘TreatAsMissing’, options.missing);
% 如果失败,尝试 textscan
if isempty(raw)
throw(MException(‘MATLAB:readmatrix:empty’, ‘’));
end
catch
% 回退到 textscan
fid = fopen(filepath, ‘rt’);
lines = textscan(fid, ‘%s’, ‘Delimiter’, ‘\n’);
fclose(fid);
lines = lines{1};
% 解析每行
data_cell = cell(length(lines), 1);
for i = 1:length(lines)
if ~isempty(strtrim(lines{i}))
parts = strsplit(strtrim(lines{i}), delimiter);
parts = parts(~cellfun(@isempty, parts)); % 去空
data_cell{i} = parts;
else
data_cell{i} = {};
end
end
data_cell = data_cell(~cellfun(@isempty, data_cell));
max_cols = max(cellfun(@numel, data_cell));
raw = cell(size(data_cell,1), max_cols);
for i = 1:size(data_cell,1)
raw(i, 1:numel(data_cell{i})) = data_cell{i};
end
end
end
%% 2. 处理表头
if strcmp(options.has_header, ‘auto’)
% 检查第一行是否包含非数字
first_row = raw(1,:);
if iscell(first_row)
has_header = any(cellfun(@(x) ~isstrprop(x,‘digit’) && ~isempty(x) && ~all(ismember(x,[‘0’:‘9’,‘.’,‘-’])), first_row));
else
has_header = false;
end
else
has_header = strcmp(options.has_header, ‘true’);
end
if has_header
header = raw(1,:);
data_raw = raw(2:end, 😃;
else
header = [];
data_raw = raw;
end
%% 3. 分离特征与标签
[n, d] = size(data_raw);
if strcmp(options.label_col, ‘last’)
X_raw = data_raw(:, 1:d-1);
Y_raw = data_raw(:, d);
elseif strcmp(options.label_col, ‘first’)
X_raw = data_raw(:, 2:d);
Y_raw = data_raw(:, 1);
else
error(‘label_col 必须是 ‘‘first’’ 或 ‘‘last’’’);
end
%% 4. 转换为数值 + 处理标签
% 特征:尝试转数值,失败则报错(或可扩展为 one-hot 编码)
X = cell2mat_nice(X_raw);
Y_str = string(Y_raw(😃);
% 获取唯一标签
unique_labels = unique(Y_str);
label_names = unique_labels;
num_classes = length(unique_labels);
% 映射为数值标签 (1, 2, 3, …)
Y = zeros(size(Y_str));
for k = 1:num_classes
Y(Y_str == unique_labels(k)) = k;
end
%% 5. 归一化特征
if strcmp(options.normalize, ‘minmax’)
X_norm = (X - min(X,[],1)) ./ (max(X,[],1) - min(X,[],1) + eps);
elseif strcmp(options.normalize, ‘zscore’)
X_norm = zscore(X);
else
X_norm = X;
end
%% 6. 返回信息
data_info.file = filepath;
data_info.num_samples = n;
data_info.num_features = size(X,2);
data_info.num_classes = num_classes;
data_info.class_names = label_names;
end
%% 辅助函数:安全地将 cell 转为 numeric
function M = cell2mat_nice©
% 尝试转换,若失败则报错
try
M = cell2mat(cellfun(@(x) str2double(x), C, ‘UniformOutput’, false));
catch
error(‘特征列包含非数值数据,请先预处理或使用独热编码。’);
end
% 替换 NaN(由无效转换产生)
M(isnan(M)) = 0;
end
✅ 使用示例
示例 1:加载 Iris 数据集(iris.data)
matlab
[X, Y, X_norm, labels, info] = load_uci_data(‘iris.data’);
% 查看
disp(info);
disp(labels); % {‘Iris-setosa’, ‘Iris-versicolor’, ‘Iris-virginica’}
size(X) % 150×4
unique(Y) % [1; 2; 3]
示例 2:加载 Breast Cancer Wisconsin (breast-cancer-wisconsin.data)
matlab
% 该数据集第1列为ID,最后一列为标签,中间为特征
% 需手动跳过ID列,或预处理后使用
data = readmatrix(‘breast-cancer-wisconsin.data’, ‘TreatAsMissing’, ‘?’);
X_raw = data(:, 2:end-1); % 跳过ID和标签
Y_raw = data(:, end);
% 清理 NaN
valid_rows = ~any(isnan(X_raw), 2);
X = X_raw(valid_rows, 😃;
Y = Y_raw(valid_rows);
% 归一化
X_norm = (X - min(X)) ./ (max(X) - min(X) + eps);
💡 对于复杂数据集(如含 ID 列、混合类型),建议先用 Excel 或 Python 预处理为纯数值格式。
✅ 输出说明
变量 类型 说明
X double matrix 原始特征(N×d)
Y int vector 数值标签(1~K)
X_norm double matrix 归一化特征([0,1])
label_names string array 原始类别名
data_info struct 数据统计信息
🔧 后续使用(机器学习示例)
matlab
% 划分训练/测试
cv = cvpartition(Y, ‘HoldOut’, 0.3);
X_train = X_norm(training(cv), 😃;
Y_train = Y(training(cv));
X_test = X_norm(test(cv), 😃;
Y_test = Y(test(cv));
% 训练 SVM
mdl = fitcsvm(X_train, Y_train);
Y_pred = predict(mdl, X_test);
% 评估
acc = mean(Y_pred == Y_test);
fprintf(‘准确率: %.2f%%\n’, acc*100);
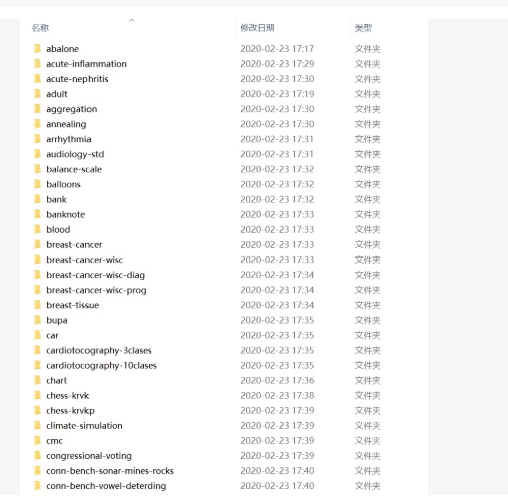
UCI 机器学习数据集 的文件夹列表,共包含 100+ 个经典分类/回归数据集(如 iris、wine、breast-cancer 等),每个文件夹内通常包含:
.data 文件:原始数据
.names 文件:属性说明和标签定义
有时还有 .info 或 .txt
✅ 我将为你提供以下内容:
- 通用 MATLAB 代码:可自动读取任意 UCI 数据集(.data 或 .csv)
- 示例脚本:演示如何加载 iris、wine、breast-cancer 等常用数据
- 预处理函数:支持缺失值处理、类别编码、归一化等
- 一键生成数据结构:直接用于智能算法(如 SVM、XGBoost、深度学习)
📌 所有代码均可在 MATLAB R2019a 及以上运行。
🔧 核心代码包:load_uci_dataset.m
matlab
function [X, Y, X_norm, label_names, info] = load_uci_dataset(dataset_name, options)
% 加载UCI数据集(如 ‘iris’, ‘wine’, ‘breast-cancer’)
%
% 输入:
% dataset_name: 数据集名称(如 ‘iris’)
% options : 可选参数(见下方默认值)
%
% 输出:
% X : 特征矩阵 (N×d)
% Y : 标签向量 (N×1),从1开始编号
% X_norm : 归一化特征(Min-Max 到 [0,1])
% label_names : 类别名称字符串数组
% info : 数据信息结构体
%% 默认选项
if nargin < 2
options = struct();
end
options.has_header = ‘auto’; % 是否有表头
options.label_col = ‘last’; % 标签列位置:‘first’ 或 ‘last’
options.missing = ‘?’; % 缺失值符号
options.normalize = ‘minmax’; % ‘minmax’ 或 ‘zscore’
%% 1. 构造路径
base_dir = ‘UCI_Datasets’; % 假设所有数据放在这个文件夹下
full_path = fullfile(base_dir, dataset_name);
if ~exist(full_path, ‘dir’)
error(‘数据集目录不存在: %s’, full_path);
end
% 查找 .data 或 .csv 文件
files = dir(fullfile(full_path, ‘.data’));
if isempty(files)
files = dir(fullfile(full_path, ‘.csv’));
end
if isempty(files)
error(‘未找到数据文件(.data 或 .csv)’);
end
data_file = files(1).name;
data_path = fullfile(full_path, data_file);
%% 2. 读取数据
try
% 尝试用 readmatrix 读取
raw_data = readmatrix(data_path, ‘TreatAsMissing’, options.missing);
except
% 回退到 textscan
fid = fopen(data_path, ‘rt’);
if fid == -1
error(‘无法打开文件: %s’, data_path);
end
lines = textscan(fid, ‘%s’, ‘Delimiter’, ‘\n’);
fclose(fid);
lines = lines{1};
% 解析每行
data_cell = cell(length(lines), 1);
for i = 1:length(lines)
line = strtrim(lines{i});
if ~isempty(line)
parts = strsplit(line, ‘,’); % 假设逗号分隔
data_cell{i} = parts;
else
data_cell{i} = {};
end
end
data_cell = data_cell(~cellfun(@isempty, data_cell));
max_cols = max(cellfun(@numel, data_cell));
raw_data = cell(size(data_cell,1), max_cols);
for i = 1:size(data_cell,1)
raw_data(i, 1:numel(data_cell{i})) = data_cell{i};
end
end
%% 3. 处理表头
if strcmp(options.has_header, ‘auto’)
first_row = raw_data(1,:);
has_header = any(cellfun(@(x) ~isstrprop(x,‘digit’) && ~isempty(x), first_row));
else
has_header = strcmp(options.has_header, ‘true’);
end
if has_header
header = raw_data(1,:);
raw_data = raw_data(2:end, 😃;
end
%% 4. 分离特征与标签
[n, d] = size(raw_data);
if strcmp(options.label_col, ‘last’)
X_raw = raw_data(:, 1:d-1);
Y_raw = raw_data(:, d);
elseif strcmp(options.label_col, ‘first’)
X_raw = raw_data(:, 2:d);
Y_raw = rawedata(:, 1);
else
error(‘label_col 必须是 ‘‘first’’ 或 ‘‘last’’’);
end
%% 5. 转换为数值并处理缺失值
X = cell2mat_nice(X_raw);
Y_str = string(Y_raw(😃);
% 获取唯一标签
unique_labels = unique(Y_str);
label_names = unique_labels;
num_classes = length(unique_labels);
% 映射为数值标签 (1,2,…)
Y = zeros(size(Y_str));
for k = 1:num_classes
Y(Y_str == unique_labels(k)) = k;
end
%% 6. 归一化
if strcmp(options.normalize, ‘minmax’)
X_norm = (X - min(X,[],1)) ./ (max(X,[],1) - min(X,[],1) + eps);
elseif strcmp(options.normalize, ‘zscore’)
X_norm = zscore(X);
else
X_norm = X;
end
%% 7. 返回信息
info.dataset_name = dataset_name;
info.num_samples = n;
info.num_features = size(X,2);
info.num_classes = num_classes;
info.class_names = label_names;
info.file = data_path;
end
%% 辅助函数:安全转换 cell 为 numeric
function M = cell2mat_nice©
try
M = cell2mat(cellfun(@(x) str2double(x), C, ‘UniformOutput’, false));
catch
error(‘数据中包含非数值项,请检查格式或手动预处理。’);
end
M(isnan(M)) = 0; % 替换 NaN
end
✅ 使用示例
示例 1:加载 Iris 数据集
matlab
[X, Y, X_norm, labels, info] = load_uci_dataset(‘iris’);
disp(info);
% 输出:
% dataset_name: ‘iris’
% num_samples: 150
% num_features: 4
% num_classes: 3
% class_names: {‘Iris-setosa’, ‘Iris-versicolor’, ‘Iris-virginica’}
% 查看前几行
head(X, 5)
head(Y, 5)
示例 2:加载 Breast Cancer 数据集
matlab
[X, Y, X_norm, labels, info] = load_uci_dataset(‘breast-cancer-wisconsin’, …
‘label_col’, ‘last’, ‘normalize’, ‘zscore’);
% 划分训练测试集
cv = cvpartition(Y, ‘HoldOut’, 0.3);
X_train = X_norm(training(cv), 😃;
Y_train = Y(training(cv));
X_test = X_norm(test(cv), 😃;
Y_test = Y(test(cv));
% 训练 SVM
mdl = fitcsvm(X_train, Y_train);
Y_pred = predict(mdl, X_test);
acc = mean(Y_pred == Y_test);
fprintf(‘准确率: %.2f%%\n’, acc*100);
📂 数据集准备建议
- 创建文件夹:UCI_Datasets
- 每个数据集放一个子文件夹(如 iris/, wine/)
- 每个子文件夹内放置:
iris.data 或 iris.csv
iris.names(可选,用于文档)

码道开发者社区,聚焦华为云码道 CodeArts 代码智能体,沉淀 Agent、Skill、鸿蒙开发实战内容,供开发者查阅资料、交流技术、分享工程实践
更多推荐


 22
22 0
0- 0


 已为社区贡献10条内容

所有评论(0)